海洋学研究 ›› 2025, Vol. 43 ›› Issue (1): 79-89.DOI: 10.3969/j.issn.1001-909X.2025.01.008
热带红树林河口海-气CO2通量季节变化及控制因素——以海南东寨港为例
王洋1,2( ), 全鑫1,3, 庄雅1,2, 赵化德1, 苏剑钟1,4,*()
- 1.海南大学 南海海洋资源利用国家重点实验室,海南 海口 570228
2.海南大学 海洋生物与水产学院,海南 海口 570228
3.海南大学 生态学院,海南 海口 570228
4.海南大学 海洋科学与工程学院,海南 海口 570228
-
收稿日期:2024-11-19修回日期:2025-01-12出版日期:2025-03-15发布日期:2025-05-30 -
通讯作者:*苏剑钟(1990—),男,副研究员,主要从事河口近海碳的生物地球化学循环研究,E-mail: jzsu@hainanu.edu.cn。 -
作者简介:王洋(2000—),男,河南省南阳市人,主要从事海-气界面CO2通量研究,E-mail:mr_tata@hainanu.edu.cn。 -
基金资助:国家自然科学基金青年科学基金项目(42306050);海南省科技人才创新项目(KJRC2023B04);海南大学科研启动基金项目(KYQD(ZR)-22026);海南大学科研启动基金项目(XJ2400005860)
Seasonal variation and controlling factors of air-sea CO2 flux in tropical mangrove estuary: A case study of Dongzhai Harbor, Hainan
WANG Yang1,2(), QUAN Xin1,3, ZHUANG Ya1,2, ZHAO Huade1, SU Jianzhong1,4,*()
- 1. State Key Laboratory of Marine Resources Utilization in South China Sea, Hainan University, Haikou 570228, China
2. School of Marine Biology and Fisheries, Hainan University, Haikou 570228, China
3. School of Ecology, Hainan University, Haikou 570228, China
4. School of Marine Science and Engineering, Hainan University, Haikou 570228, China
-
Received:2024-11-19Revised:2025-01-12Online:2025-03-15Published:2025-05-30
摘要:
近岸河口受到陆源输入的影响,通常表现为大气二氧化碳(CO2)的源,而红树林生态系统一般是大气CO2的汇。因此,准确衡量红树林河口的CO2排放量对构建区域和全球碳收支具有重要的现实意义。东寨港位于海南岛东北部,向外连通琼州海峡,有5条主要河流汇入,西部和南部分布着成片红树林。本研究分别于2022年12月(干季)、2023年12月(干季)、2022年5月(湿季)、2023年8月(湿季)对东寨港、周边的主要河流以及邻近海域开展了4次野外调查。结果显示,表层水体CO2分压(pCO2)呈现从河流向港内、港外递减的趋势;温度、物理混合与生物活动都会影响干湿季pCO2空间分布;湿季CO2通量(8.8±8.2 mmol·m-2·d-1)大于干季(3.4±3.6 mmol·m-2·d-1),全年平均值为6.1±6.3 mmol·m-2·d-1,在全球红树林河口中处于较低水平;东寨港水体的年CO2排放量将抵消红树林植物固碳量的10.4%~21.9%。
中图分类号:
引用本文
王洋, 全鑫, 庄雅, 赵化德, 苏剑钟. 热带红树林河口海-气CO2通量季节变化及控制因素——以海南东寨港为例[J]. 海洋学研究, 2025, 43(1): 79-89.
WANG Yang, QUAN Xin, ZHUANG Ya, ZHAO Huade, SU Jianzhong. Seasonal variation and controlling factors of air-sea CO2 flux in tropical mangrove estuary: A case study of Dongzhai Harbor, Hainan[J]. Journal of Marine Sciences, 2025, 43(1): 79-89.
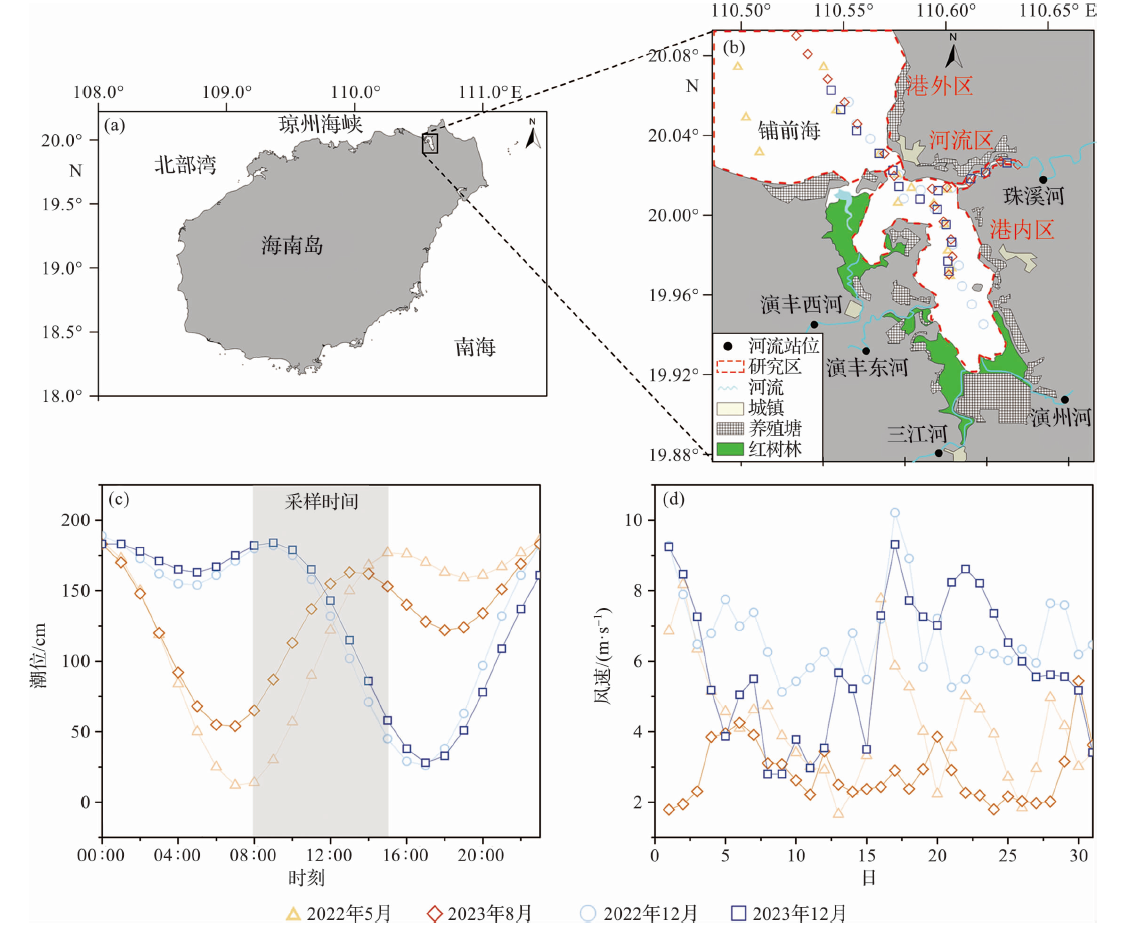
图1 研究区域位置(a)、采样站位(b)、采样当天潮位(c)与当月的日平均风速(d)
Fig.1 Location of the study area (a), sampling stations (b), tidal height at sampling days (c) and daily averaged wind speed at sampling month (d)
| 河流 | 季节 | 温度/℃ | 盐度 | pH | DIC /(μmol·kg-1) | TA /(μmol·kg-1) | DO /(μmol·kg-1) | DO饱和度/% | AOU /(μmol·kg-1) | pCO2 /μatm |
|---|---|---|---|---|---|---|---|---|---|---|
| 演丰西河 | 干季 | 18.1 | 0.10 | 6.89 | 1 126 | 1 048 | 234 | 79 | 62 | 2 941 |
| 湿季 | 27.9 | 0.03 | 6.58 | 877 | 757 | 192 | 78 | 54 | 2 761 | |
| 演丰东河 | 干季 | 18.3 | 0.09 | 6.81 | 854 | 730 | 224 | 76 | 71 | 3 657 |
| 湿季 | 29.0 | 0.02 | 6.34 | 750 | 600 | 168 | 68 | 74 | 4 318 | |
| 三江河 | 干季 | 18.7 | 0.06 | 6.85 | 749 | 618 | 259 | 90 | 29 | 3 501 |
| 湿季 | 29.4 | 0.01 | 6.34 | 689 | 549 | 183 | 75 | 57 | 4 511 | |
| 演州河 | 干季 | 19.0 | 0.06 | 6.78 | 672 | 535 | 226 | 77 | 69 | 2 990 |
| 湿季 | 30.0 | 0.04 | 6.27 | 640 | 520 | 143 | 59 | 95 | 4 939 | |
| 珠溪河 | 干季 | 18.1 | 0.10 | 6.94 | 661 | 544 | 224 | 75 | 76 | 2 113 |
| 湿季 | 28.8 | 0.10 | 6.26 | 780 | 693 | 178 | 73 | 64 | 3 900 |
表1 东寨港周边主要河流水体各理化参数的平均值
Tab.1 The average values of various physical and chemical parameters of major rivers around Dongzhai Harbor
| 河流 | 季节 | 温度/℃ | 盐度 | pH | DIC /(μmol·kg-1) | TA /(μmol·kg-1) | DO /(μmol·kg-1) | DO饱和度/% | AOU /(μmol·kg-1) | pCO2 /μatm |
|---|---|---|---|---|---|---|---|---|---|---|
| 演丰西河 | 干季 | 18.1 | 0.10 | 6.89 | 1 126 | 1 048 | 234 | 79 | 62 | 2 941 |
| 湿季 | 27.9 | 0.03 | 6.58 | 877 | 757 | 192 | 78 | 54 | 2 761 | |
| 演丰东河 | 干季 | 18.3 | 0.09 | 6.81 | 854 | 730 | 224 | 76 | 71 | 3 657 |
| 湿季 | 29.0 | 0.02 | 6.34 | 750 | 600 | 168 | 68 | 74 | 4 318 | |
| 三江河 | 干季 | 18.7 | 0.06 | 6.85 | 749 | 618 | 259 | 90 | 29 | 3 501 |
| 湿季 | 29.4 | 0.01 | 6.34 | 689 | 549 | 183 | 75 | 57 | 4 511 | |
| 演州河 | 干季 | 19.0 | 0.06 | 6.78 | 672 | 535 | 226 | 77 | 69 | 2 990 |
| 湿季 | 30.0 | 0.04 | 6.27 | 640 | 520 | 143 | 59 | 95 | 4 939 | |
| 珠溪河 | 干季 | 18.1 | 0.10 | 6.94 | 661 | 544 | 224 | 75 | 76 | 2 113 |
| 湿季 | 28.8 | 0.10 | 6.26 | 780 | 693 | 178 | 73 | 64 | 3 900 |
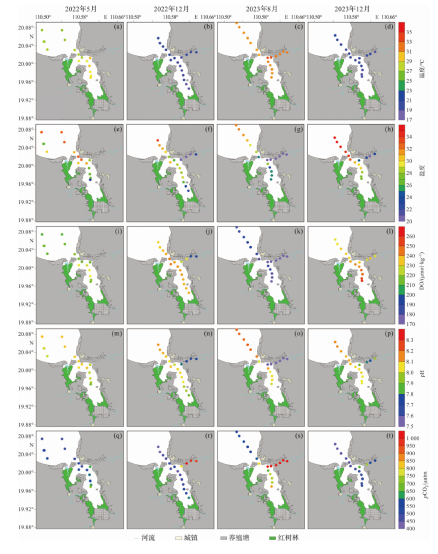
图2 东寨港各航次温度(a~d)、盐度(e~h)、DO(i~l)、pH(m~p)和pCO2(q~t)的空间分布
Fig.2 Spatial distributions of temperature (a-d), salinity (e-h), dissolved oxygen (i-l), pH (m-p) and pCO2(q-t) for each cruise at Dongzhai Harbor
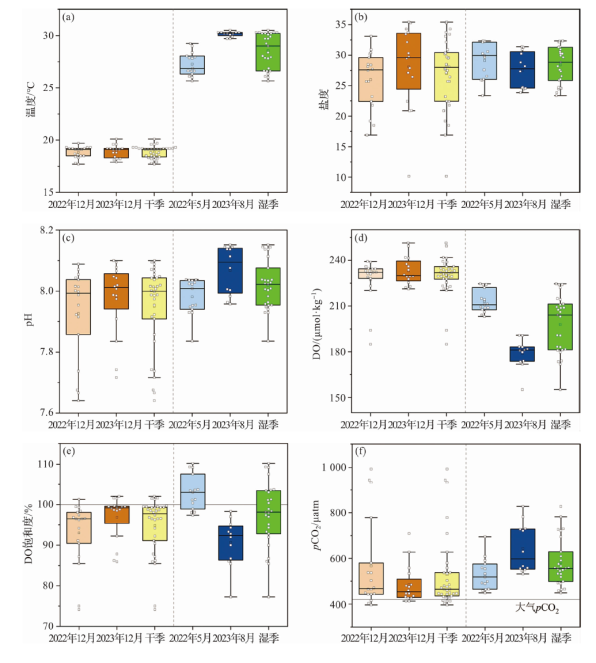
图3 航次期间东寨港内、外水体的温度(a)、盐度(b)、pH(c)、DO(d)、DO饱和度(e)、pCO2(f)
Fig.3 Water temperature (a), salinity (b), pH (c), dissolved oxygen (d), dissolved oxygen saturation (e), and pCO2 (f) in the inner and outer Dongzhai Harbor during the cruises
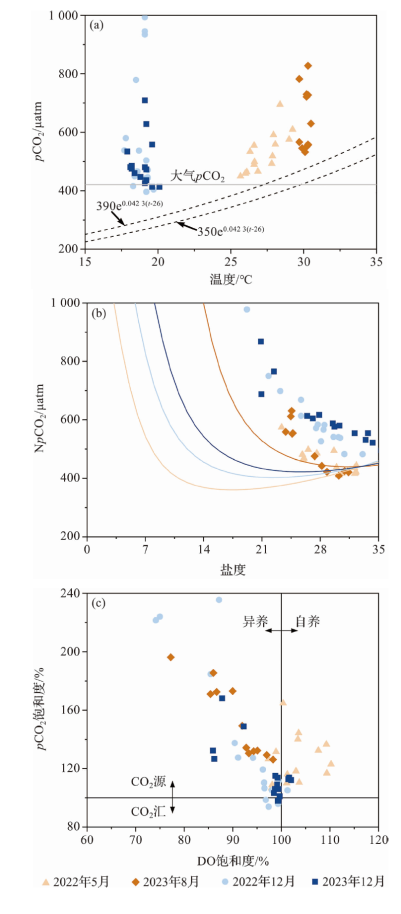
图4 温度与pCO2的分布(a)、盐度与NpCO2的分布(b)以及DO饱和度与pCO2饱和度的分布(c) (图b中曲线为仅发生物理混合时NpCO2随盐度的分布。)
Fig.4 Distributions of temperature and pCO2 (a), salinity and NpCO2 (b), and dissolved oxygen saturation and pCO2 saturation (c) (Curves in Fig.b show the distribution of NpCO2 with salinity when only physical mixing occurs.)
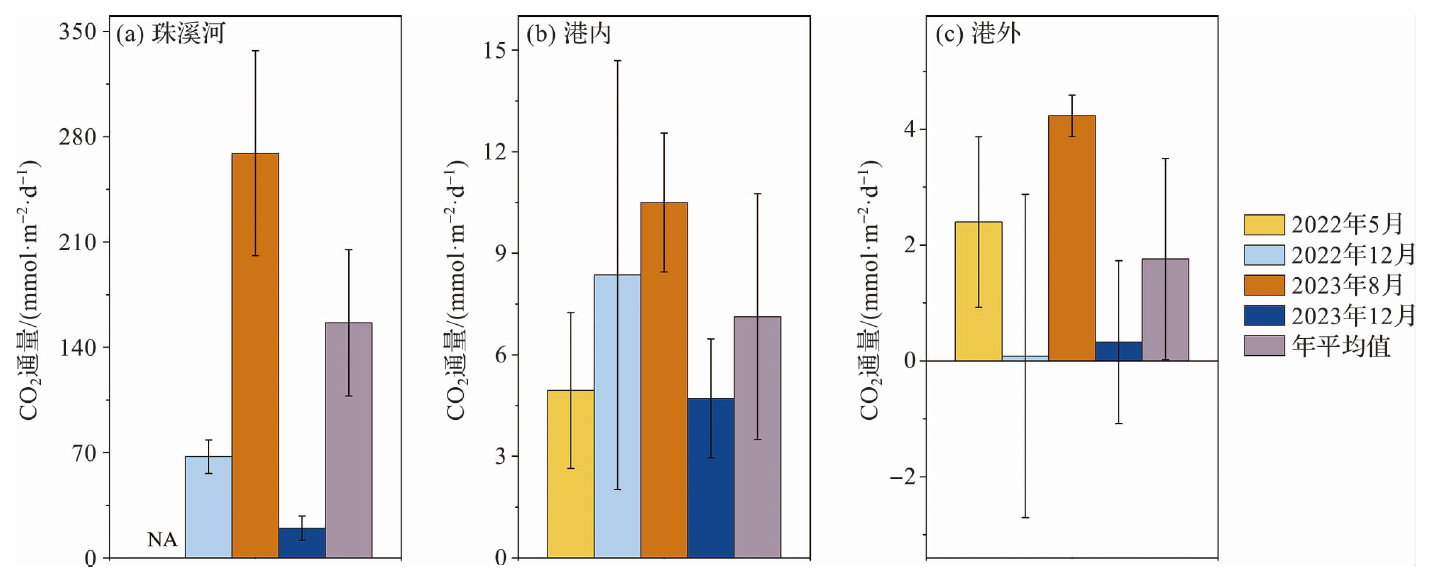
图5 航次期间东寨港不同区域CO2通量平均值
Fig.5 Average CO2 fluxes in different areas at Dongzhai Harbor during the cruises
| 国家/地区 | 河口 | 水体pCO2 /μatm | CO2通量 /mmol·m-2·d-1 |
|---|---|---|---|
| 安达曼群岛 | Kalighat | 1 574~7 888 | 70.8 |
| 安达曼群岛 | Wright Myo | 1 246~7 703 | 61.1 |
| 澳大利亚 | Moreton Bay | 9 513~27 188 | 201.6 |
| 澳大利亚 | Constant Creek Estuary | 449~1 632 | 21.5~50.5 |
| 澳大利亚 | Burdekin Estuary | 617~13 031 | 221.0 |
| 澳大利亚 | Fitzroy Estuary | 699~7 947 | 139.2 |
| 澳大利亚 | Johnstone Estuary | 387~9 744 | 110.6 |
| 澳大利亚 | Korogoro Creek | 869.0 | |
| 澳大利亚 | Evans Head | 997±317 | 63.0±166.0 |
| 澳大利亚 | Darwin | 622~1 263 | 40.0 |
| 澳大利亚 | Hinchinbrook Island | 1 341~3 304 | 30.0 |
| 澳大利亚 | Jacobs Well | 531~5 036 | 19.0 |
| 澳大利亚 | Newcastle | 404~3 224 | 46.0 |
| 澳大利亚 | Seventeen Seventy | 314~1 399 | 10.0 |
| 澳大利亚 | Barwon Heads | 0.4 | |
| 巴布亚新 几内亚 | Nagada Creek | 540~1 680 | 43.6 |
| 巴哈马 | Norman’s Pond | 395~690 | 13.8 |
| 巴西 | San Francisco Estuary | 298~2 007 | 0.7 |
| 巴西 | Itacuraca Creek | 660~7 700 | 113.5 |
| 百慕大群岛 | Mangrove Bay | 268~4 823 | 65.0 |
| 肯尼亚 | Tana River Delta | 230~5 300 | 58.0 |
| 肯尼亚 | Gazi Bay | 575~6 435 | 54.3 |
| 马达加斯加 | Betsiboka | 270~1 530 | 9.1±14.2 |
| 美国 | Shark River | 975~6 016 | 102.0 |
| 坦桑尼亚 | Ras Dege | 400~5 050 | 33.7 |
| 坦桑尼亚 | Mtoni | 400~1 700 | 18.0 |
| 印度 | Malta Estuary | 358~3 033 | 2.3 |
| 印度 | Dhamra Estuary | 146~751 | 0.6~218.0 |
| 印度 | Thakuran Estuary | 160~737 | 0.3 |
| 印度 | Sundarbans | 376~561 | 4.7 |
| 印度 | Gaderu Creek | 2 215±864 | 56.0±100.9 |
| 印度 | Gautami Godavari Estuary | 430~4 770 | 43.4 |
| 印度 | Mooriganga Estuary | 152~1 530 | 7.7 |
| 印度 | Saptamukhi Estuary | 193~4 000 | 28.5 |
| 印度 | Cochin | 1 500~3 800 | 55.1 |
| 印度 | Hooghly Estuary | 70~1 530 | -2.8~84.4 |
| 越南 | Kien Vang | 713~8 136 | 93.5 |
| 越南 | Tam Giang | 528~11 481 | 135.0 |
| 中国 | 漳江口云霄溪 | 1 733±605 | 57.6~115.2 |
| 中国 | 东寨港 | 426~8 910 | 12.1(港内+河道) |
| 中国 | 东寨港 | 396~8 910 | 6.1(整个区域) |
表2 东寨港与其他红树林河口[21?-23]的CO2通量比较
Tab.2 Comparison of CO2fluxes among Dongzhai Harbor and other mangrove estuaries[21?-23]
| 国家/地区 | 河口 | 水体pCO2 /μatm | CO2通量 /mmol·m-2·d-1 |
|---|---|---|---|
| 安达曼群岛 | Kalighat | 1 574~7 888 | 70.8 |
| 安达曼群岛 | Wright Myo | 1 246~7 703 | 61.1 |
| 澳大利亚 | Moreton Bay | 9 513~27 188 | 201.6 |
| 澳大利亚 | Constant Creek Estuary | 449~1 632 | 21.5~50.5 |
| 澳大利亚 | Burdekin Estuary | 617~13 031 | 221.0 |
| 澳大利亚 | Fitzroy Estuary | 699~7 947 | 139.2 |
| 澳大利亚 | Johnstone Estuary | 387~9 744 | 110.6 |
| 澳大利亚 | Korogoro Creek | 869.0 | |
| 澳大利亚 | Evans Head | 997±317 | 63.0±166.0 |
| 澳大利亚 | Darwin | 622~1 263 | 40.0 |
| 澳大利亚 | Hinchinbrook Island | 1 341~3 304 | 30.0 |
| 澳大利亚 | Jacobs Well | 531~5 036 | 19.0 |
| 澳大利亚 | Newcastle | 404~3 224 | 46.0 |
| 澳大利亚 | Seventeen Seventy | 314~1 399 | 10.0 |
| 澳大利亚 | Barwon Heads | 0.4 | |
| 巴布亚新 几内亚 | Nagada Creek | 540~1 680 | 43.6 |
| 巴哈马 | Norman’s Pond | 395~690 | 13.8 |
| 巴西 | San Francisco Estuary | 298~2 007 | 0.7 |
| 巴西 | Itacuraca Creek | 660~7 700 | 113.5 |
| 百慕大群岛 | Mangrove Bay | 268~4 823 | 65.0 |
| 肯尼亚 | Tana River Delta | 230~5 300 | 58.0 |
| 肯尼亚 | Gazi Bay | 575~6 435 | 54.3 |
| 马达加斯加 | Betsiboka | 270~1 530 | 9.1±14.2 |
| 美国 | Shark River | 975~6 016 | 102.0 |
| 坦桑尼亚 | Ras Dege | 400~5 050 | 33.7 |
| 坦桑尼亚 | Mtoni | 400~1 700 | 18.0 |
| 印度 | Malta Estuary | 358~3 033 | 2.3 |
| 印度 | Dhamra Estuary | 146~751 | 0.6~218.0 |
| 印度 | Thakuran Estuary | 160~737 | 0.3 |
| 印度 | Sundarbans | 376~561 | 4.7 |
| 印度 | Gaderu Creek | 2 215±864 | 56.0±100.9 |
| 印度 | Gautami Godavari Estuary | 430~4 770 | 43.4 |
| 印度 | Mooriganga Estuary | 152~1 530 | 7.7 |
| 印度 | Saptamukhi Estuary | 193~4 000 | 28.5 |
| 印度 | Cochin | 1 500~3 800 | 55.1 |
| 印度 | Hooghly Estuary | 70~1 530 | -2.8~84.4 |
| 越南 | Kien Vang | 713~8 136 | 93.5 |
| 越南 | Tam Giang | 528~11 481 | 135.0 |
| 中国 | 漳江口云霄溪 | 1 733±605 | 57.6~115.2 |
| 中国 | 东寨港 | 426~8 910 | 12.1(港内+河道) |
| 中国 | 东寨港 | 396~8 910 | 6.1(整个区域) |
| [1] | WMO温室气体公报第20期[R]. 2024. https://library.wmo.int/viewer/69466/. |
| WMO Greenhouse Gas Bulletin No.20[R]. 2024. https://library.wmo.int/viewer/69466/. | |
| [2] | CHEN C T A, HUANG T H, CHEN Y C, et al. Air-sea exchanges of CO2 in the world’s coastal seas[J]. Biogeo-sciences, 2013, 10(10): 6509-6544. |
| [3] | DAI M H, ZHAI W D, CAI W J, et al. Effects of an estuarine plume-associated bloom on the carbonate system in the lower reaches of the Pearl River estuary and the coastal zone of the northern South China Sea[J]. Continental Shelf Research, 2008, 28(12): 1416-1423. |
| [4] | WANG F M, SANDERS C J, SANTOS I R, et al. Global blue carbon accumulation in tidal wetlands increases with climate change[J]. National Science Review, 2021, 8(9): nwaa296. |
| [5] | ALONGI D M, MUKHOPADHYAY S K. Contribution of mangroves to coastal carbon cycling in low latitude seas[J]. Agricultural and Forest Meteorology, 2015, 213: 266-272. |
| [6] | TWILLEY R R, CHEN R H, HARGIS T. Carbon sinks in mangroves and their implications to carbon budget of tropical coastal ecosystems[J]. Water, Air, and Soil Pollution, 1992, 64: 265-288. |
| [7] | SIPPO J Z, MAHER D T, TAIT D R, et al. Are mangroves drivers or buffers of coastal acidification? Insights from alkalinity and dissolved inorganic carbon export estimates across a latitudinal transect[J]. Global Biogeochemical Cycles, 2016, 30(5): 753-766. |
| [8] | 国家林业局草业局. 国际重要湿地|海南东寨港国际重要湿地:我国红树林连片面积最大保护区[R]. 2022. http://www.fnrrc.com/hangyedongtai/7241.html. |
| National Forestry and Grassland Adminstration. Wetlands of international importance|dongzhaigang wetland of international importance, Hainan Province: The largest mangrove contiguous area in China [R]. 2022. http://www.fnrrc.com/hangyedongtai/7241.html. | |
| [9] | 石彭兰, 王强俊, 谭佐莉, 等. 冬季东寨港微微型浮游植物丰度、分布及影响因素[J]. 海洋与湖沼, 2023, 54(4):1058-1069. |
| SHI P L, WANG Q J, TAN Z L, et al. Abundance, distribution and environmental control of picophytoplankton in the winter Dongzhai harbor[J]. Oceanologia et Limnologia Sinica, 2023, 54(4): 1058-1069. | |
| [10] | 邢孔敏, 陈石泉, 蔡泽富, 等. 海南东寨港表层沉积物重金属分布特征及污染评价[J]. 海洋科学进展, 2018, 36(3):478-488. |
| XING K M, CHEN S Q, CAI Z F, et al. Distribution characteristics and pollution evaluation of heavy metals in surface sediment of Dongzhai Harbor, Hainan Province[J]. Advances in Marine Science, 2018, 36(3): 478-488. | |
| [11] | 李伟光, 张京红, 刘少军, 等. 海南岛干旱的气象特征及监测指标[J]. 热带生物学报, 2022, 13(4):324-330. |
| LI W G, ZHANG J H, LIU S J, et al. Meteorological characteristics and monitoring index of drought in Hainan Island[J]. Journal of Tropical Biology, 2022, 13(4): 324-330. | |
| [12] | KNAP A H, MICHAELS A F, CLOSE A R, et al. Protocols for the Joint Global Ocean Flux Study (JGOFS) Core Mea-surements[C]. Paris, France, UNESCO-IOC, 1996: 18-32. |
| [13] | TAKAHASHI T, OLAFSSON J, GODDARD J G, et al. Seasonal variation of CO2 and nutrients in the high-latitude surface oceans: A comparative study[J]. Global Biogeo-chemical Cycles, 1993, 7(4): 843-878. |
| [14] | YANG W, GUO X H, CAO Z M, et al. Carbonate dynamics in a tropical coastal system in the South China Sea featuring upwelling, river plumes and submarine groundwater discharge[J]. Science China Earth Sciences, 2022, 65: 2267-2284. |
| [15] | JIANG L Q, CAI W J, WANG Y C. A comparative study of carbon dioxide degassing in river- and marine-dominated estuaries[J]. Limnology and Oceanography, 2008, 53(6): 2603-2615. |
| [16] | ZHAI W D, DAI M H, CAI W J, et al. The partial pressure of carbon dioxide and air-sea fluxes in the northern South China Sea in spring, summer and autumn[J]. Marine Chemistry, 2005, 96(1/2): 87-97. |
| [17] |
GUEST M A, CONNOLLY R M, LEE S Y, et al. Mechanism for the small-scale movement of carbon among estuarine habitats: Organic matter transfer not crab movement[J]. Oecologia, 2006, 148(1): 88-96.
PMID |
| [18] | VACHON D, SADRO S, BOGARD M J, et al. Paired O2-CO2 measurements provide emergent insights into aquatic ecosystem function[J]. Limnology and Oceanography Letters, 2020, 5(4): 287-294. |
| [19] | 杨旭锋, 于培松, 潘建明, 等. 2019年夏末长江口及其邻近海域走航pCO2变化及控制机制[J]. 海洋学研究, 2021, 39(4):63-72. |
| YANG X F, YU P S, PAN J M, et al. Spatial variation of underway surface pCO2 and its controls in the Changjiang (Yangtze River) Estuary and adjacent sea area in late summer of 2019 [J]. Journal of Marine Sciences, 2021, 39(4): 63-72. | |
| [20] | JIANG Z P, CAI W J, LEHRTER J, et al. Spring net community production and its coupling with the CO2 dynamics in the surface water of the northern Gulf of Mexico[J]. Biogeosciences, 2019, 16(18): 3507-3525. |
| [21] | ROSENTRETER J A, MAHER D T, ERLER D V, et al. Methane emissions partially offset “blue carbon” burial in mangroves[J]. Science Advances, 2018, 4(6): eaao4985. |
| [22] | SWAIN S, PATTANAIK S, CHANDA A, et al. Multi-annual variability of pCO2(aq) and air-water CO2 flux in the mangrove-dominated Dhamra Estuary draining into the Bay of Bengal (India)[J]. Environmental Science and Pollution Research International, 2023, 30(51): 111021-111038. |
| [23] | LU Z Y, WANG F F, XIAO K, et al. Carbon dynamics and greenhouse gas outgassing in an estuarine mangrove wetland with high input of riverine nitrogen[J]. Biogeo-chemistry, 2023, 162(2): 221-235. |
| [24] | MARTÍNEZ CASTELLÓN S E, CATTANIO J H, BERRÊDO J F, et al. Spatial and temporal variability of carbon dioxide and methane fluxes in an Amazonian estuary[J]. International Journal of Hydrology, 2021, 5(6): 327-336. |
| [25] | HO D T, LAW C S, SMITH M J, et al. Measurements of air-sea gas exchange at high wind speeds in the Southern Ocean: Implications for global parameterizations[J]. Geophysical Research Letters, 2006, 33(16): 2006GL026817. |
| [26] | KREMER J N, REISCHAUER A, D’AVANZO C. Estuary-specific variation in the air-water gas exchange coefficient for oxygen[J]. Estuaries, 2003, 26(4): 829-836. |
| [27] | 2013 Supplement to the 2006 IPCC guidelines for national greenhouse gas inventories:Wetlands[R]. Geneva, IPCC, 2014. |
| [28] | 李翠华, 蔡榕硕, 颜秀花. 2010—2018年海南东寨港红树林湿地碳收支的变化分析[J]. 海洋通报, 2020, 39(4):488-497. |
| LI C H, CAI R S, YAN X H. Analysis on the changes of carbon budget of mangrove wetland in Hainan Dongzhaigang during 2010-2018[J]. Marine Science Bulletin, 2020, 39(4): 488-497. |
| [1] | 杨波, 张卓, 周进, 林子燚, 谢子强, 郑惠娜, 廖宝林, 肖宝华. 春季典型亚热带珊瑚礁海域海水pCO2的变化特征及其调控机制[J]. 海洋学研究, 2025, 43(1): 90-106. |
| [2] | 史万里, 胡石建. 印尼贯穿流出流海域次表层潜流的来源和季节-年际变化特征[J]. 海洋学研究, 2024, 42(4): 1-11. |
| [3] | 周学杭, 张洪海, 马昕, 陈朝晖. 基于浮标观测的春季青岛近岸海水pCO2变化及海-气CO2通量研究[J]. 海洋学研究, 2023, 41(3): 14-21. |
| [4] | 李明明, 谭可易, 黄家辉, 谢玲玲, . 北部湾东北部水团和流场季节变化:2018—2019年观测数据分析[J]. 海洋学研究, 2022, 40(3): 73-85. |
| [5] | 周益飞, 廖光洪. 基于GHSOM网络的南海风场时空变化特征分析[J]. 海洋学研究, 2022, 40(2): 19-31. |
| [6] | 黄挺, 周锋, 田娣, 张家赢. 孟加拉湾及其毗邻海域中尺度涡旋活动的冬、夏季差异[J]. 海洋学研究, 2020, 38(3): 21-30. |
| [7] | 苗燕熠, 王斌, 李德望, 金海燕, 江志兵, 马晓, 于培松, 陈建芳, 王俊洋. 大风事件对长江口及邻近海域海-气CO2通量的影响[J]. 海洋学研究, 2020, 38(1): 42-49. |
| [8] | 吕航宇, 白雁, 李骞, 江洪. 夏季珠江口海域海水CO2分压的卫星遥感反演[J]. 海洋学研究, 2018, 36(2): 1-11. |
| [9] | 李晓慧, 刘镇盛. 长江口及邻近海域浮游动物生物量分布及季节变化[J]. 海洋学研究, 2017, 35(4): 94-101. |
| [10] | 丁睿彬, 陈大可, 姜良红. 黑潮流轴在吕宋海峡的变化分析[J]. 海洋学研究, 2013, 31(2): 16-25. |
| [11] | 林丽茹, 赵辉. 南海海域浮游植物叶绿素与海表温度季节变化特征分析[J]. 海洋学研究, 2012, 30(4): 46-54. |
| [12] | 李熠, 何海伦, 陈大可. 基于海水环境和气象参数经验公式估算的东海海-气CO2通量[J]. 海洋学研究, 2012, 30(3): 30-40. |
| [13] | 林丽茹, 赵辉. 南海海域浮游植物叶绿素与海表温度季节变化特征分析[J]. 海洋学研究, 2012, 30(3): 41-48. |
| 阅读次数 | ||||||
|
全文 |
|
|||||
|
摘要 |
|
|||||