海洋学研究 ›› 2024, Vol. 42 ›› Issue (4): 21-33.DOI: 10.3969/j.issn.1001-909X.2024.04.003
南海海洋热浪面积特征及其影响因素研究
彭晓萌1,2( ), 于溢1,2,3,*(), 马文涛1,2,3, 闫运伟4
- 1.自然资源部第二海洋研究所,浙江 杭州 310012
2.卫星海洋环境动力学国家重点实验室,浙江 杭州 310012
3.东海实验室,浙江 舟山 316000
4.河海大学 海洋学院,江苏 南京 210000
-
收稿日期:2024-01-24修回日期:2024-04-01出版日期:2024-12-15发布日期:2025-02-08 -
通讯作者:于溢 -
作者简介:*于溢(1988—),男,副研究员,主要从事全球碳循环模拟及机制分析方面的研究,E-mail:yiyu@sio.org.cn。
彭晓萌(1998—),女,山东省济宁市人,主要从事海洋热浪机制分析方面的研究,E-mail:pengxm2021@163.com。 -
基金资助:中央级公益性科研院所基本科研业务费专项资金项目(JG2307)
The spatial characteristics of marine heatwaves and their influencing factors in the South China Sea
PENG Xiaomeng1,2(), YU Yi1,2,3,*(), MA Wentao1,2,3, YAN Yunwei4
- 1. Second Institute of Oceanography, MNR, Hangzhou 310012, China
2. State Key Laboratory of Satellite Ocean Environment Dynamics, Hangzhou 310012, China
3. Donghai Laboratory, Zhoushan 316000, China
4. Oceanography College, Hohai University, Nanjing 210000, China
-
Received:2024-01-24Revised:2024-04-01Online:2024-12-15Published:2025-02-08 -
Contact:YU Yi
摘要:
本研究基于1990—2020年高分辨率卫星遥感海面温度数据,采用深度优先搜索算法识别了南海海洋热浪面积,并探究了不同空间尺度南海海洋热浪的特征。研究结果表明,南海小尺度海洋热浪事件(Ⅰ类海洋热浪,面积<1.8×10⁴ km2)发生最为频繁,占总发生次数的94.20%。大尺度海洋热浪事件(Ⅲ类海洋热浪,面积>1.2×10⁵ km2)在31年期间仅发生74次,其中面积最大的热浪事件发生在2015年。进一步分析发现,不同面积海洋热浪的平均强度、持续时间以及发生频率的空间分布有显著差异性。相较于Ⅰ类海洋热浪,Ⅱ类海洋热浪(面积为1.8×10⁴~1.2×10⁵ km2)平均强度超过1.5 ℃的空间范围明显增加。统计分析表明,南海海洋热浪面积增加,其平均强度和累积强度均增强,持续时间也随之变长。Ⅲ类海洋热浪事件累积强度的中位数分别是Ⅰ类的1.4倍,是Ⅱ类的1.2倍。进一步研究发现,厄尔尼诺时期Ⅰ~Ⅲ类海洋热浪的面积均显著增加,并且存在6~7个月的滞后关系。厄尔尼诺时期Ⅲ类海洋热浪事件持续时间比拉尼娜时期长2 d。本研究探究了南海海洋热浪面积的基本特征,并进一步分析了不同空间尺度海洋热浪的共性和差异性,为研究南海海洋热浪生消特征及机制提供了新的研究思路。
中图分类号:
引用本文
彭晓萌, 于溢, 马文涛, 闫运伟. 南海海洋热浪面积特征及其影响因素研究[J]. 海洋学研究, 2024, 42(4): 21-33.
PENG Xiaomeng, YU Yi, MA Wentao, YAN Yunwei. The spatial characteristics of marine heatwaves and their influencing factors in the South China Sea[J]. Journal of Marine Sciences, 2024, 42(4): 21-33.

图1 海洋热浪定义示意图(a)及1999年1月18日南海海洋热浪空间分布(b)
Fig.1 Schematic of metrics used to define a marine heatwave (a), and distribution of MHWs in the South China Sea on January 18, 1999 (b)
| 指标 | 定义 | 计算公式 | 单位 |
|---|---|---|---|
| θclim | 在一个时段内计算的气候态SST | ℃ | |
| m90 | 气候态SST的第90百分位数 | m90(j)=P90(X) | ℃ |
| tdur | 海洋热浪持续的时间 | tdur=te-ts | d |
| f | 海洋热浪发生的频次 | f=n | 次 |
| Imean | 平均强度,即在海洋热浪持续时间中的平均异常温度 | ℃ | |
| Icum | 累积强度,即从开始时间到结束时间内异常温度的总和 | ℃·d |
表1 海洋热浪的基本特征要素
Tab.1 The metrics to character marine heatwaves
| 指标 | 定义 | 计算公式 | 单位 |
|---|---|---|---|
| θclim | 在一个时段内计算的气候态SST | ℃ | |
| m90 | 气候态SST的第90百分位数 | m90(j)=P90(X) | ℃ |
| tdur | 海洋热浪持续的时间 | tdur=te-ts | d |
| f | 海洋热浪发生的频次 | f=n | 次 |
| Imean | 平均强度,即在海洋热浪持续时间中的平均异常温度 | ℃ | |
| Icum | 累积强度,即从开始时间到结束时间内异常温度的总和 | ℃·d |
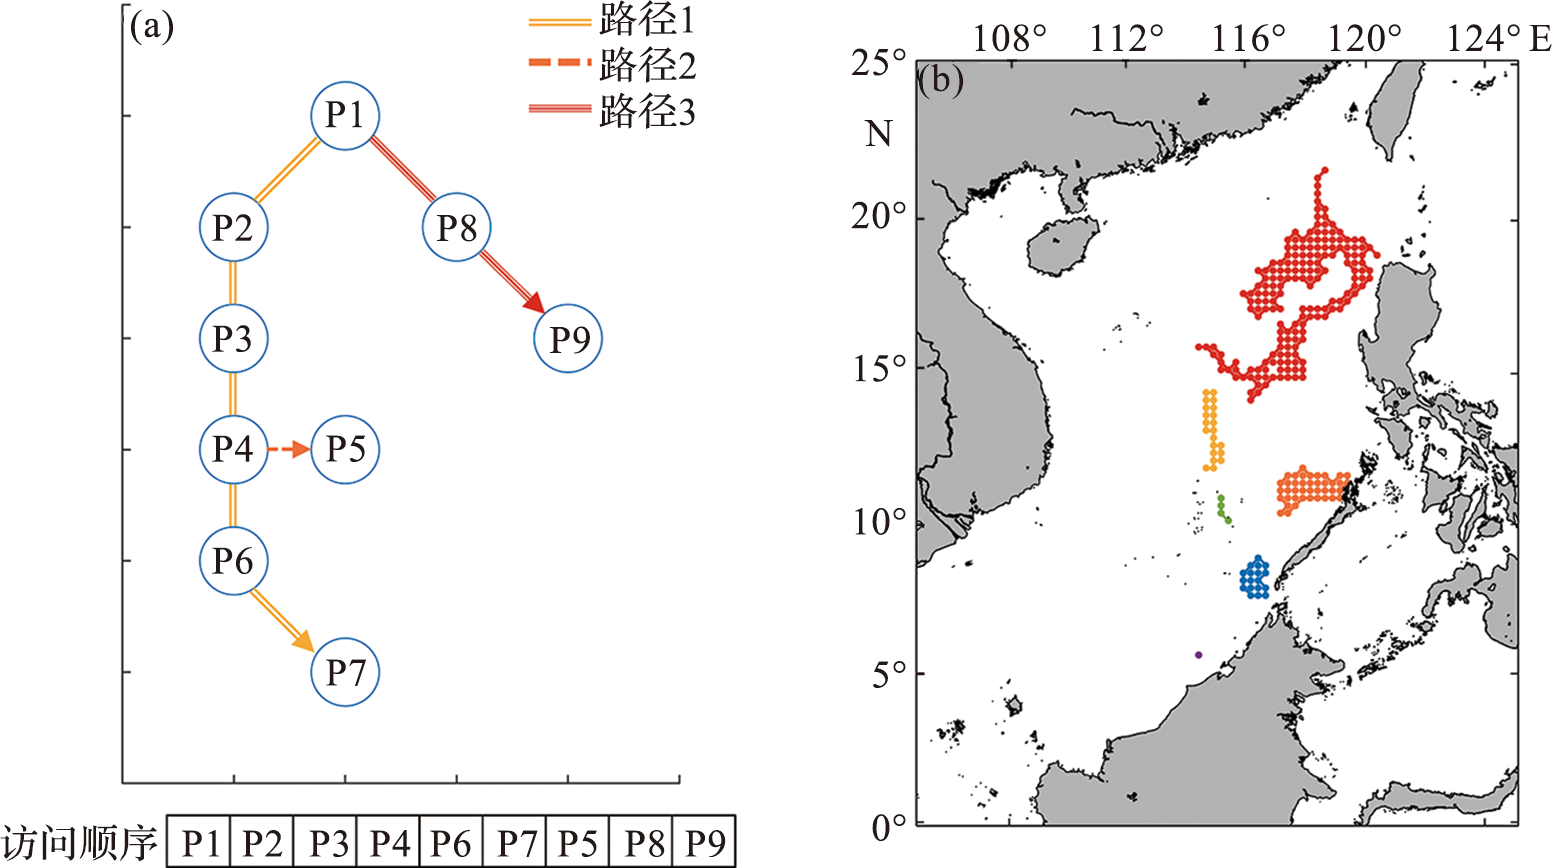
图2 深度搜索算法示例图(a)以及1999年1月18日海洋热浪事件面积示意图(b) (图a中不同颜色箭头代表不同访问顺序。图b中不同颜色代表不同的海洋热浪事件。)
Fig. 2 Depth-first-search algorithm example diagram (a), and the area diagram of the MHWs events occurred on January 18, 1999 (b) (In fig.a, arrow paths indicate the visiting order. In fig.b, different colors represent different MHWs events.)
| 类别 | 占比/% | 总面积/km2 | 总次数/次 | 平均面积/km2 |
|---|---|---|---|---|
| Ⅰ类 | 94.20 | 161 175 000 | 51 445 | 3 133 |
| Ⅱ类 | 5.67 | 109 211 100 | 3 096 | 35 275 |
| Ⅲ类 | 0.13 | 12 783 900 | 74 | 172 755 |
表2 1990—2020年三种类型海洋热浪的基本特征
Tab.2 The characteristics of three types of MHWs from 1990 to 2020
| 类别 | 占比/% | 总面积/km2 | 总次数/次 | 平均面积/km2 |
|---|---|---|---|---|
| Ⅰ类 | 94.20 | 161 175 000 | 51 445 | 3 133 |
| Ⅱ类 | 5.67 | 109 211 100 | 3 096 | 35 275 |
| Ⅲ类 | 0.13 | 12 783 900 | 74 | 172 755 |
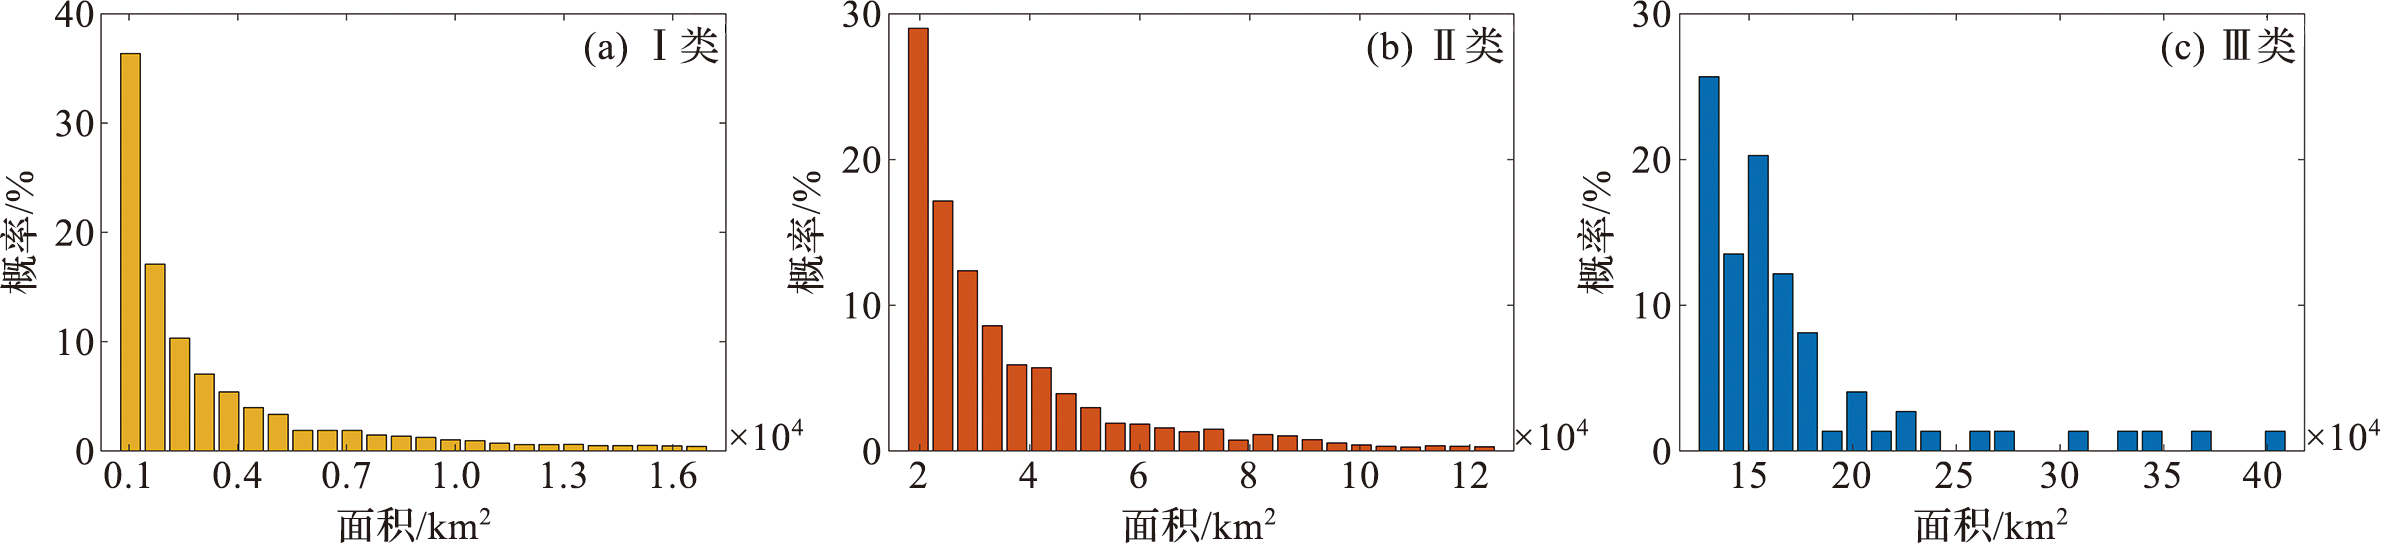
图3 三种类型南海海洋热浪面积概率密度图
Fig.3 Area probability density map of three types of MHWs in the South China Sea
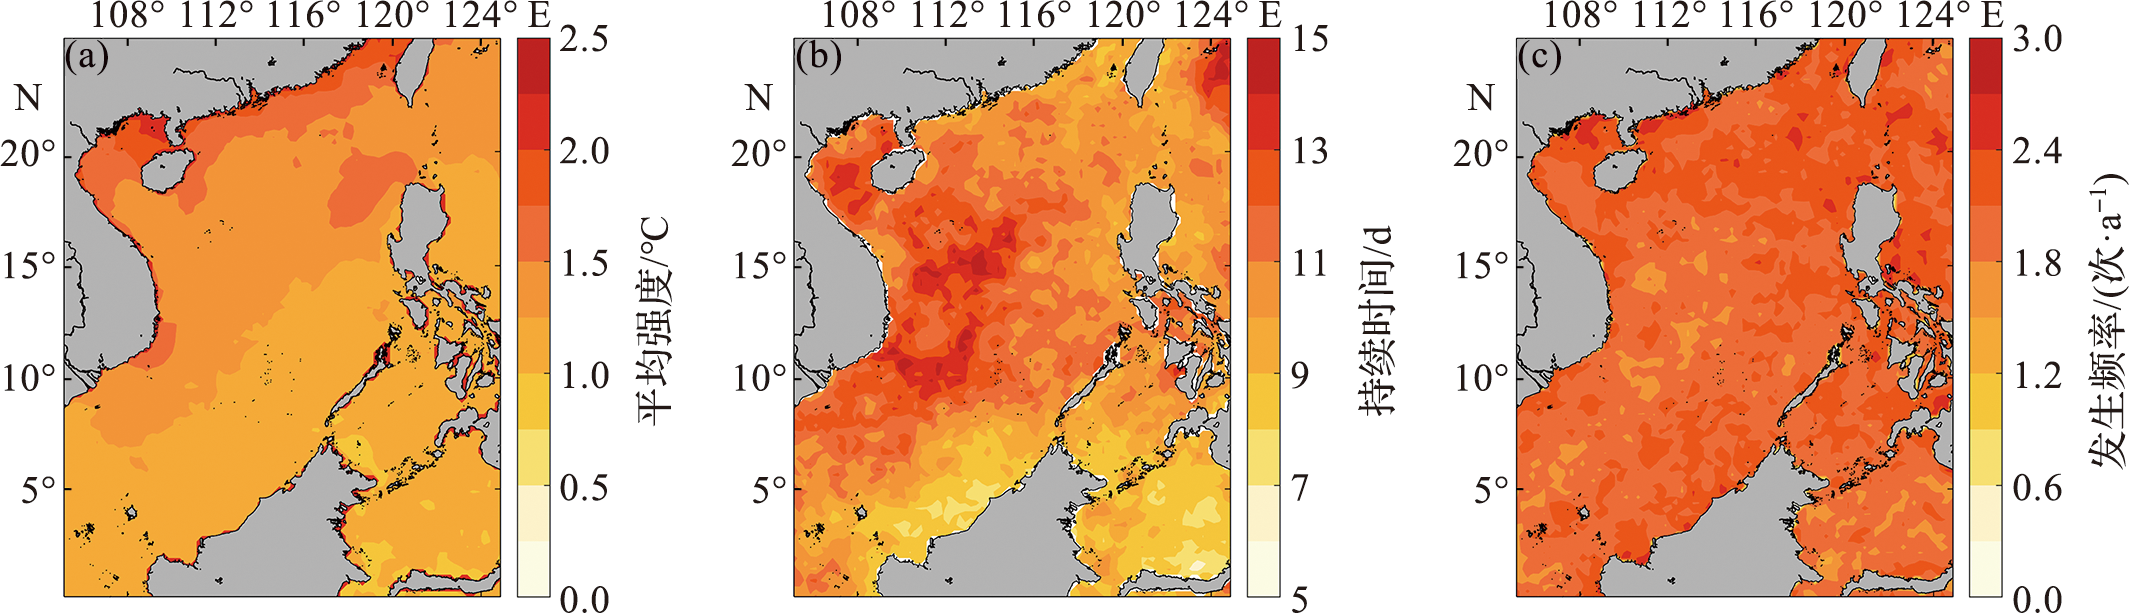
图4 1990—2020年南海海洋热浪的平均强度(a)、持续时间(b)以及发生频率(c)的空间分布
Fig.4 The distribution of mean intensity (a), duration (b) and frequency (c) of MHWs in the South China Sea from 1990 to 2020

图5 南海三种类型海洋热浪的平均强度(a, b, c)、持续时间(d, e, f)以及发生频率(g, h, i)的空间分布
Fig.5 The distribution of mean intensity (a, b, c), duration (d, e, f) and frequency (g, h, i) for three types of MHWs in the South China Sea
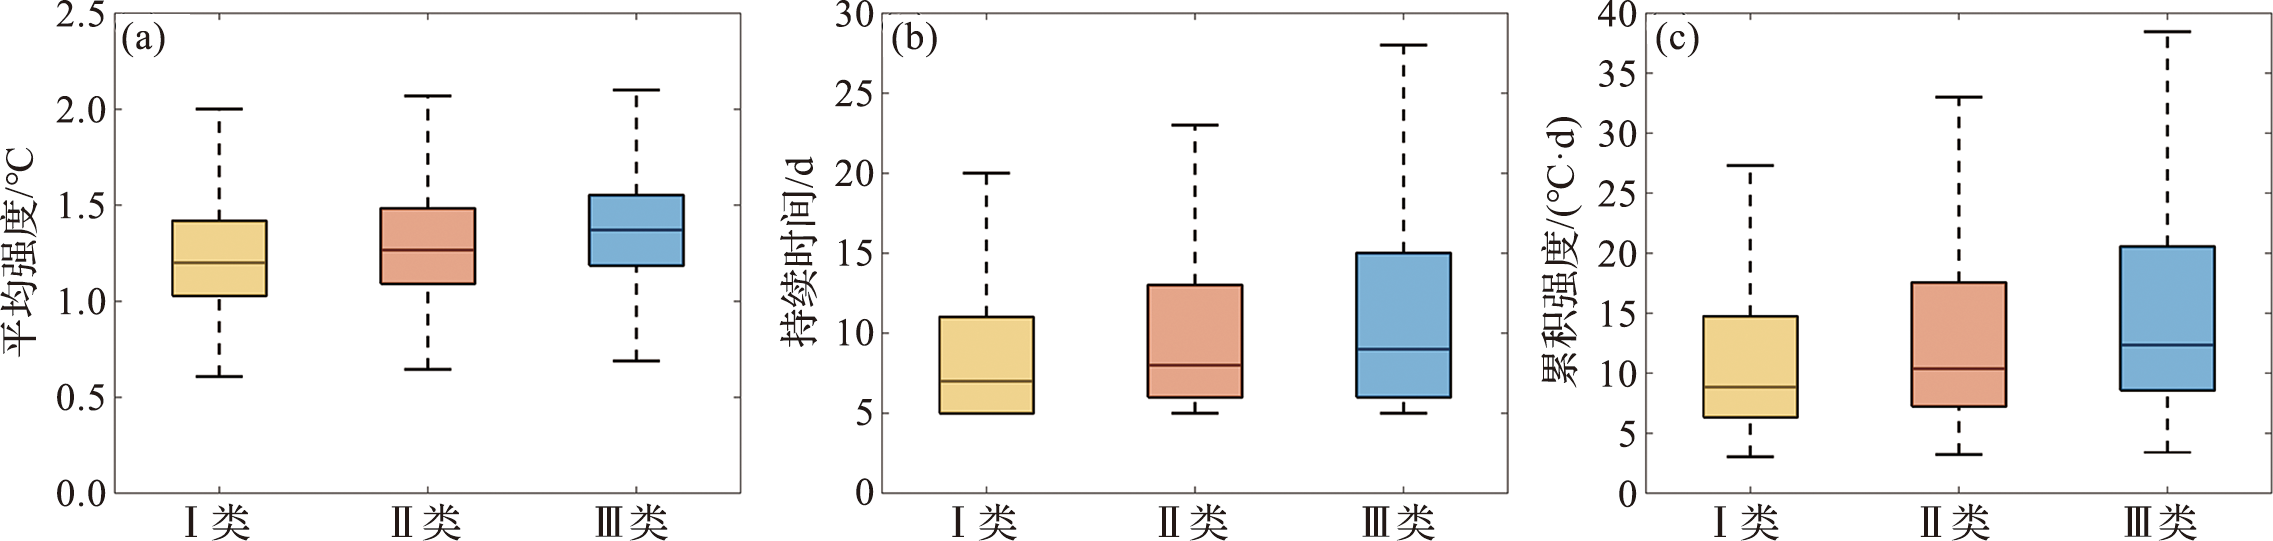
图6 三种类型海洋热浪的平均强度(a)、持续时间(b)以及累积强度(c)箱式图
Fig.6 The box plot of mean intensity (a), duration (b) and cumulative intensity (c) for three types of MHWs
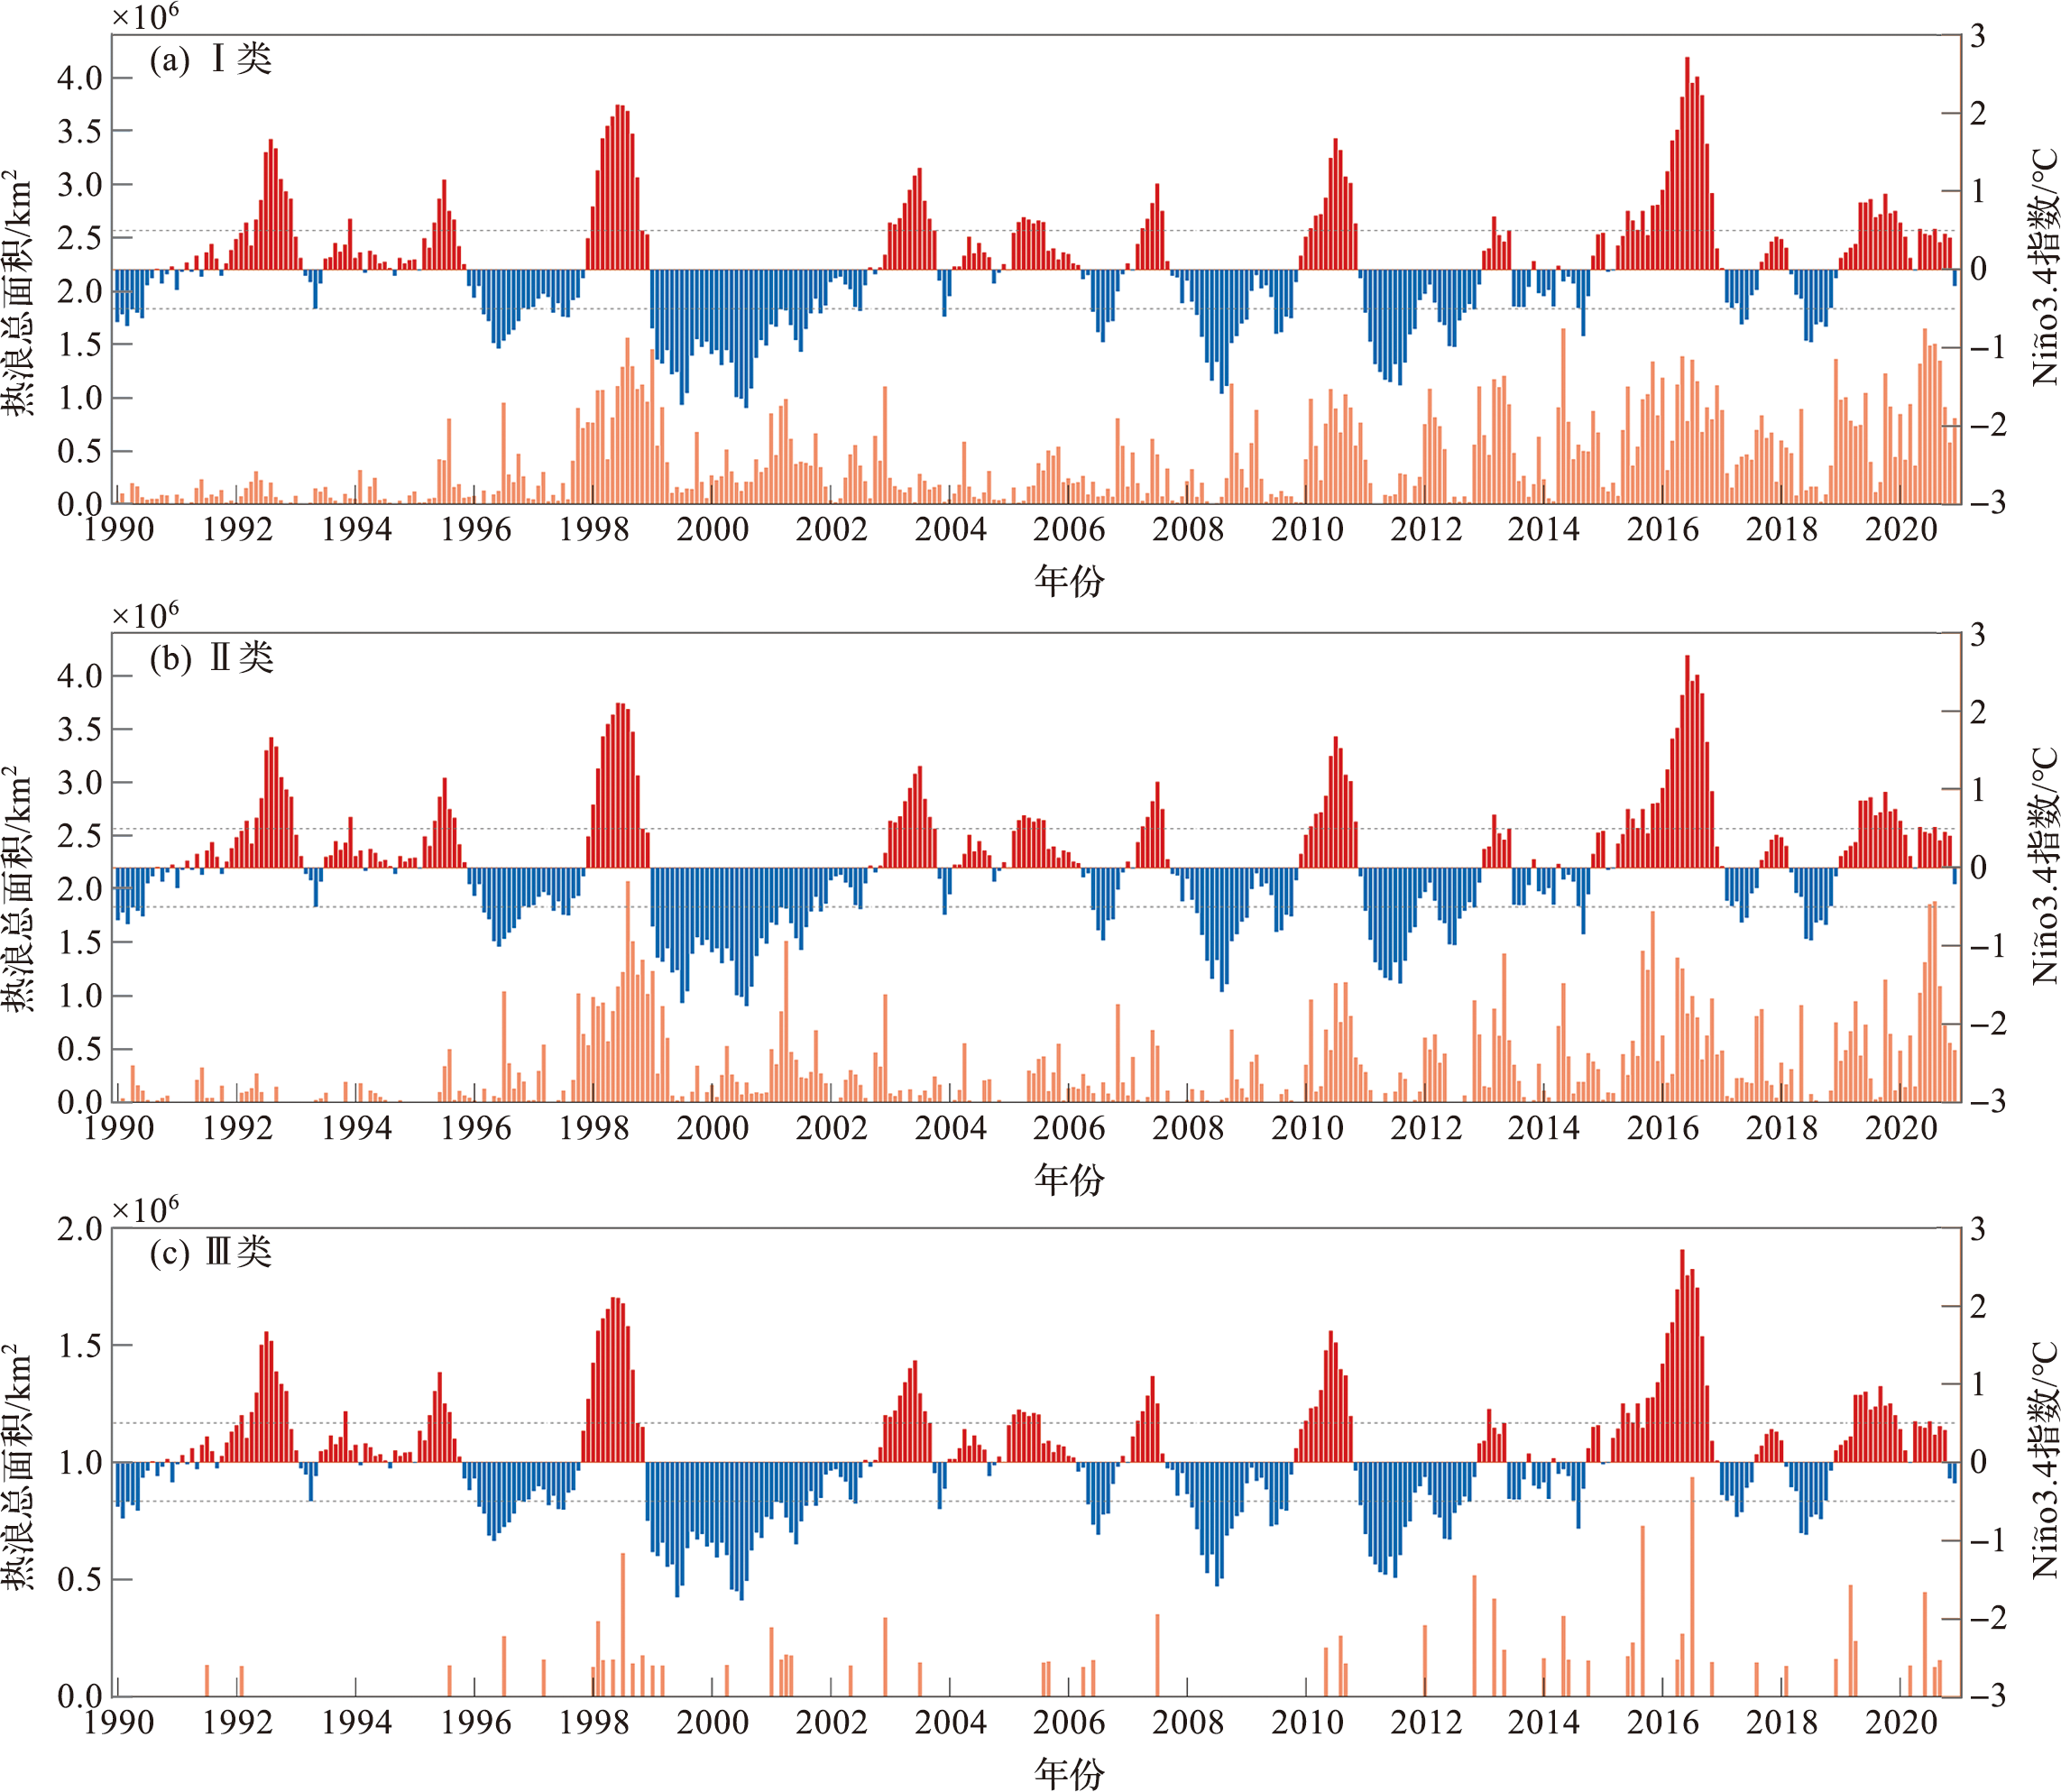
图7 1990—2020年南海三种类型海洋热浪每月发生的热浪总面积以及Ni?o3.4指数的时间序列 (图中橙色代表海洋热浪每月发生的总面积,红色表示Ni?o3.4指数正值,蓝色表示Ni?o3.4指数负值,灰色虚线为Ni?o3.4指数的±0.5 ℃等值线。)
Fig.7 The time series of monthly total area of the three types of MHWs in the South China Sea and the Ni?o3.4 index from 1990 to 2020 (The orange color denotes the monthly total area of MHWs, the red color denotes positive Ni?o3.4 index values, the blue color denotes negative Ni?o3.4 index values, the gray dashed lines denote ±0.5 ℃ Ni?o3.4 index.)
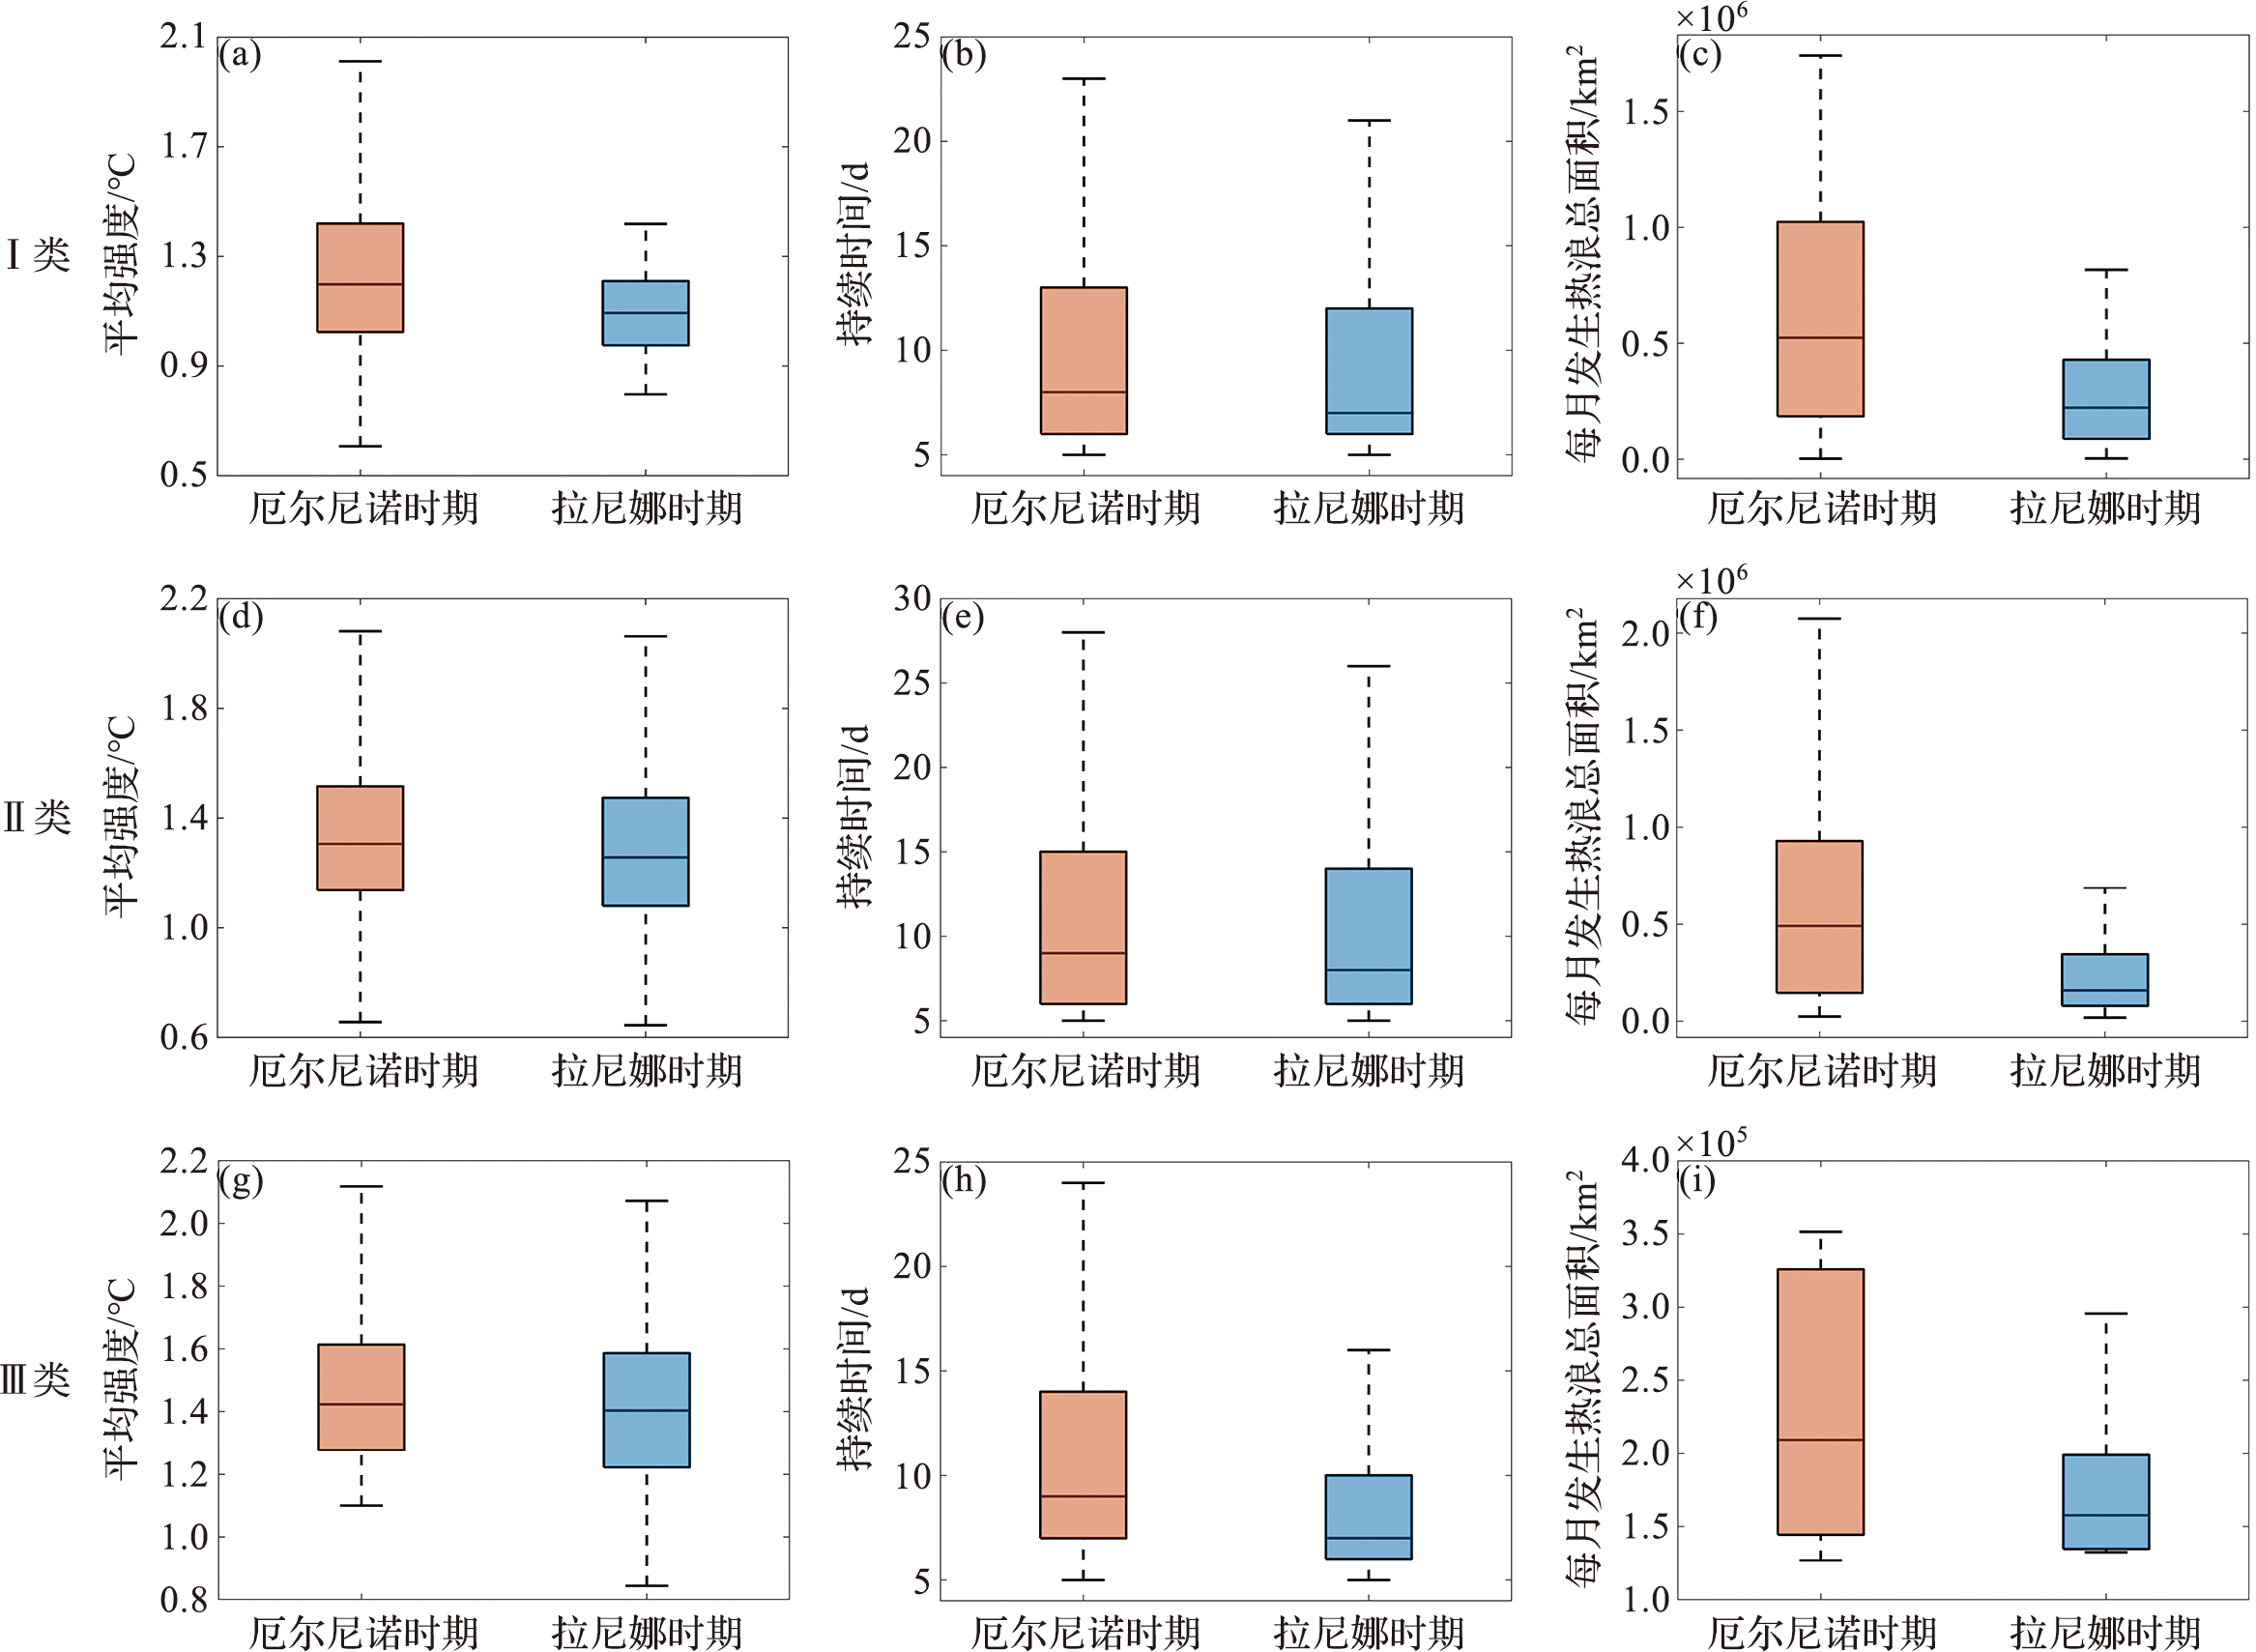
图8 厄尔尼诺时期和拉尼娜时期三种类型海洋热浪平均强度(a,d,g)、持续时间(b,e,h)以及每月发生总面积(c,f,i)的箱式图
Fig.8 The box plot of mean intensity (a, d, g), duration (b, e, h), monthly total area (c, f, i) for three types of MHWs during El Ni?o events and La Ni?a events
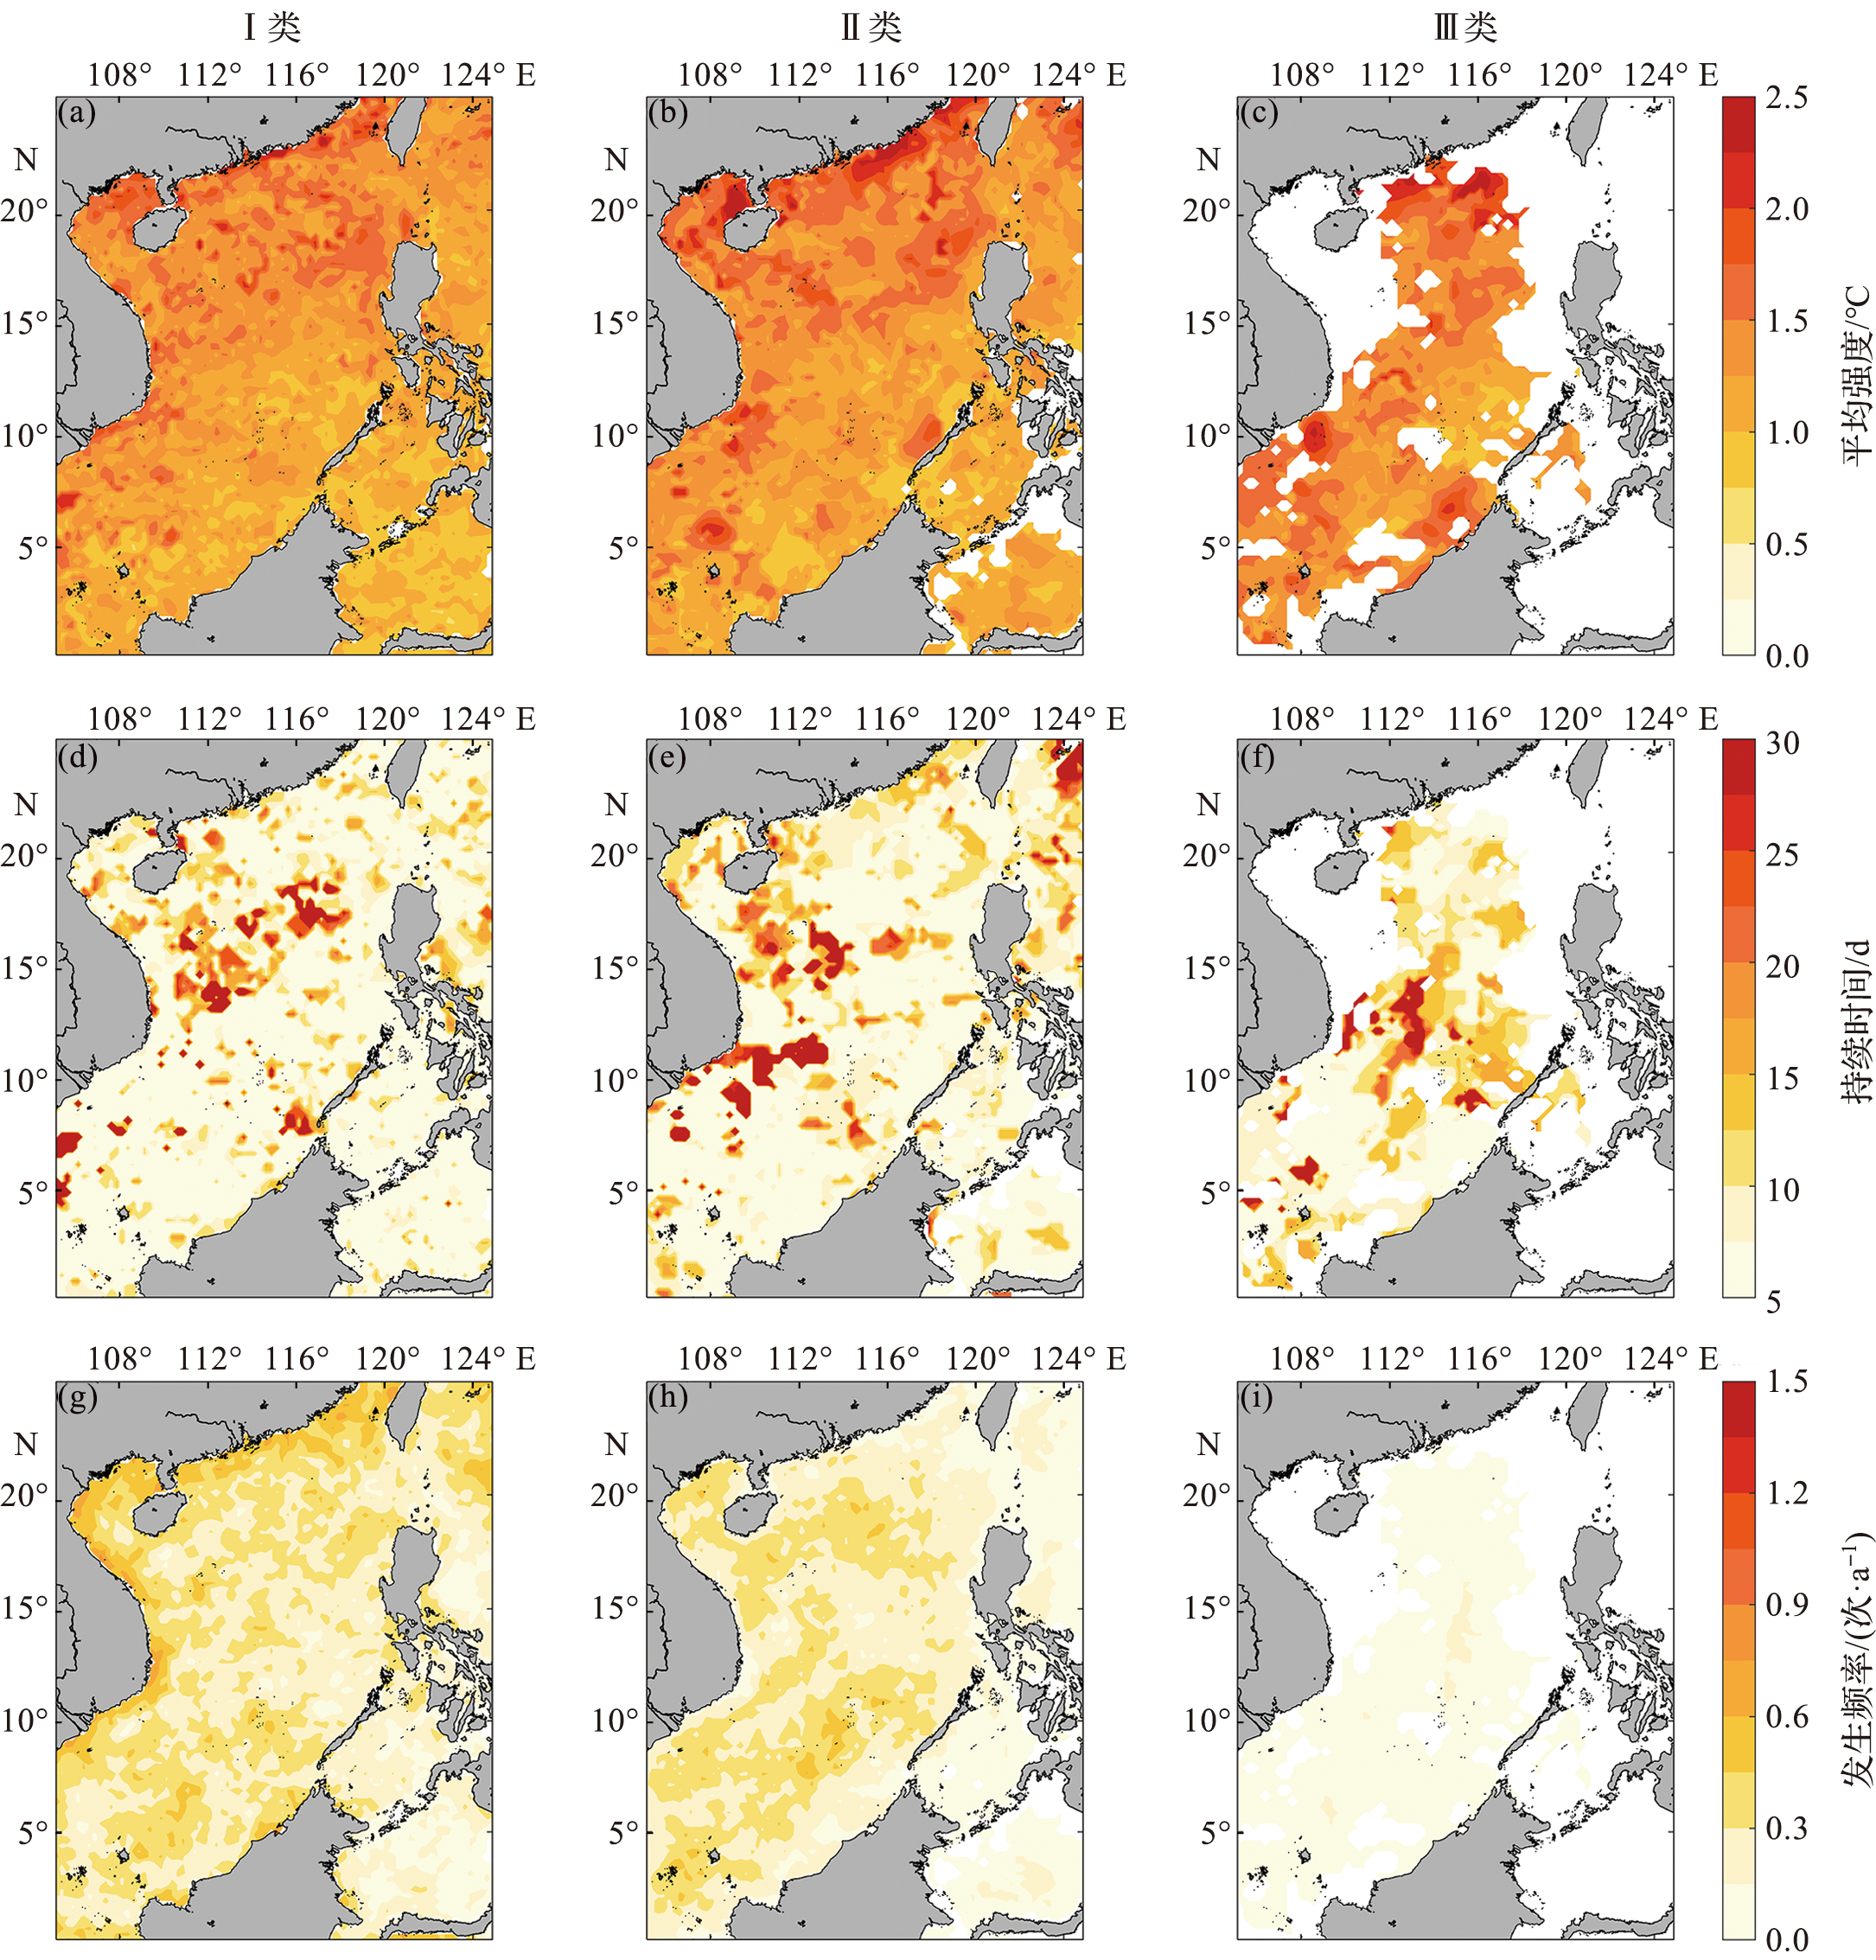
图9 厄尔尼诺事件期间南海三种类型海洋热浪的平均强度(a, b, c)、持续时间(d, e, f)以及发生频率(g, h, i)的空间分布
Fig.9 The distribution of mean intensity (a, b, c), duration (d, e, f), frequency (g, h, i) of three types of MHWs in the South China Sea during El Ni?o events
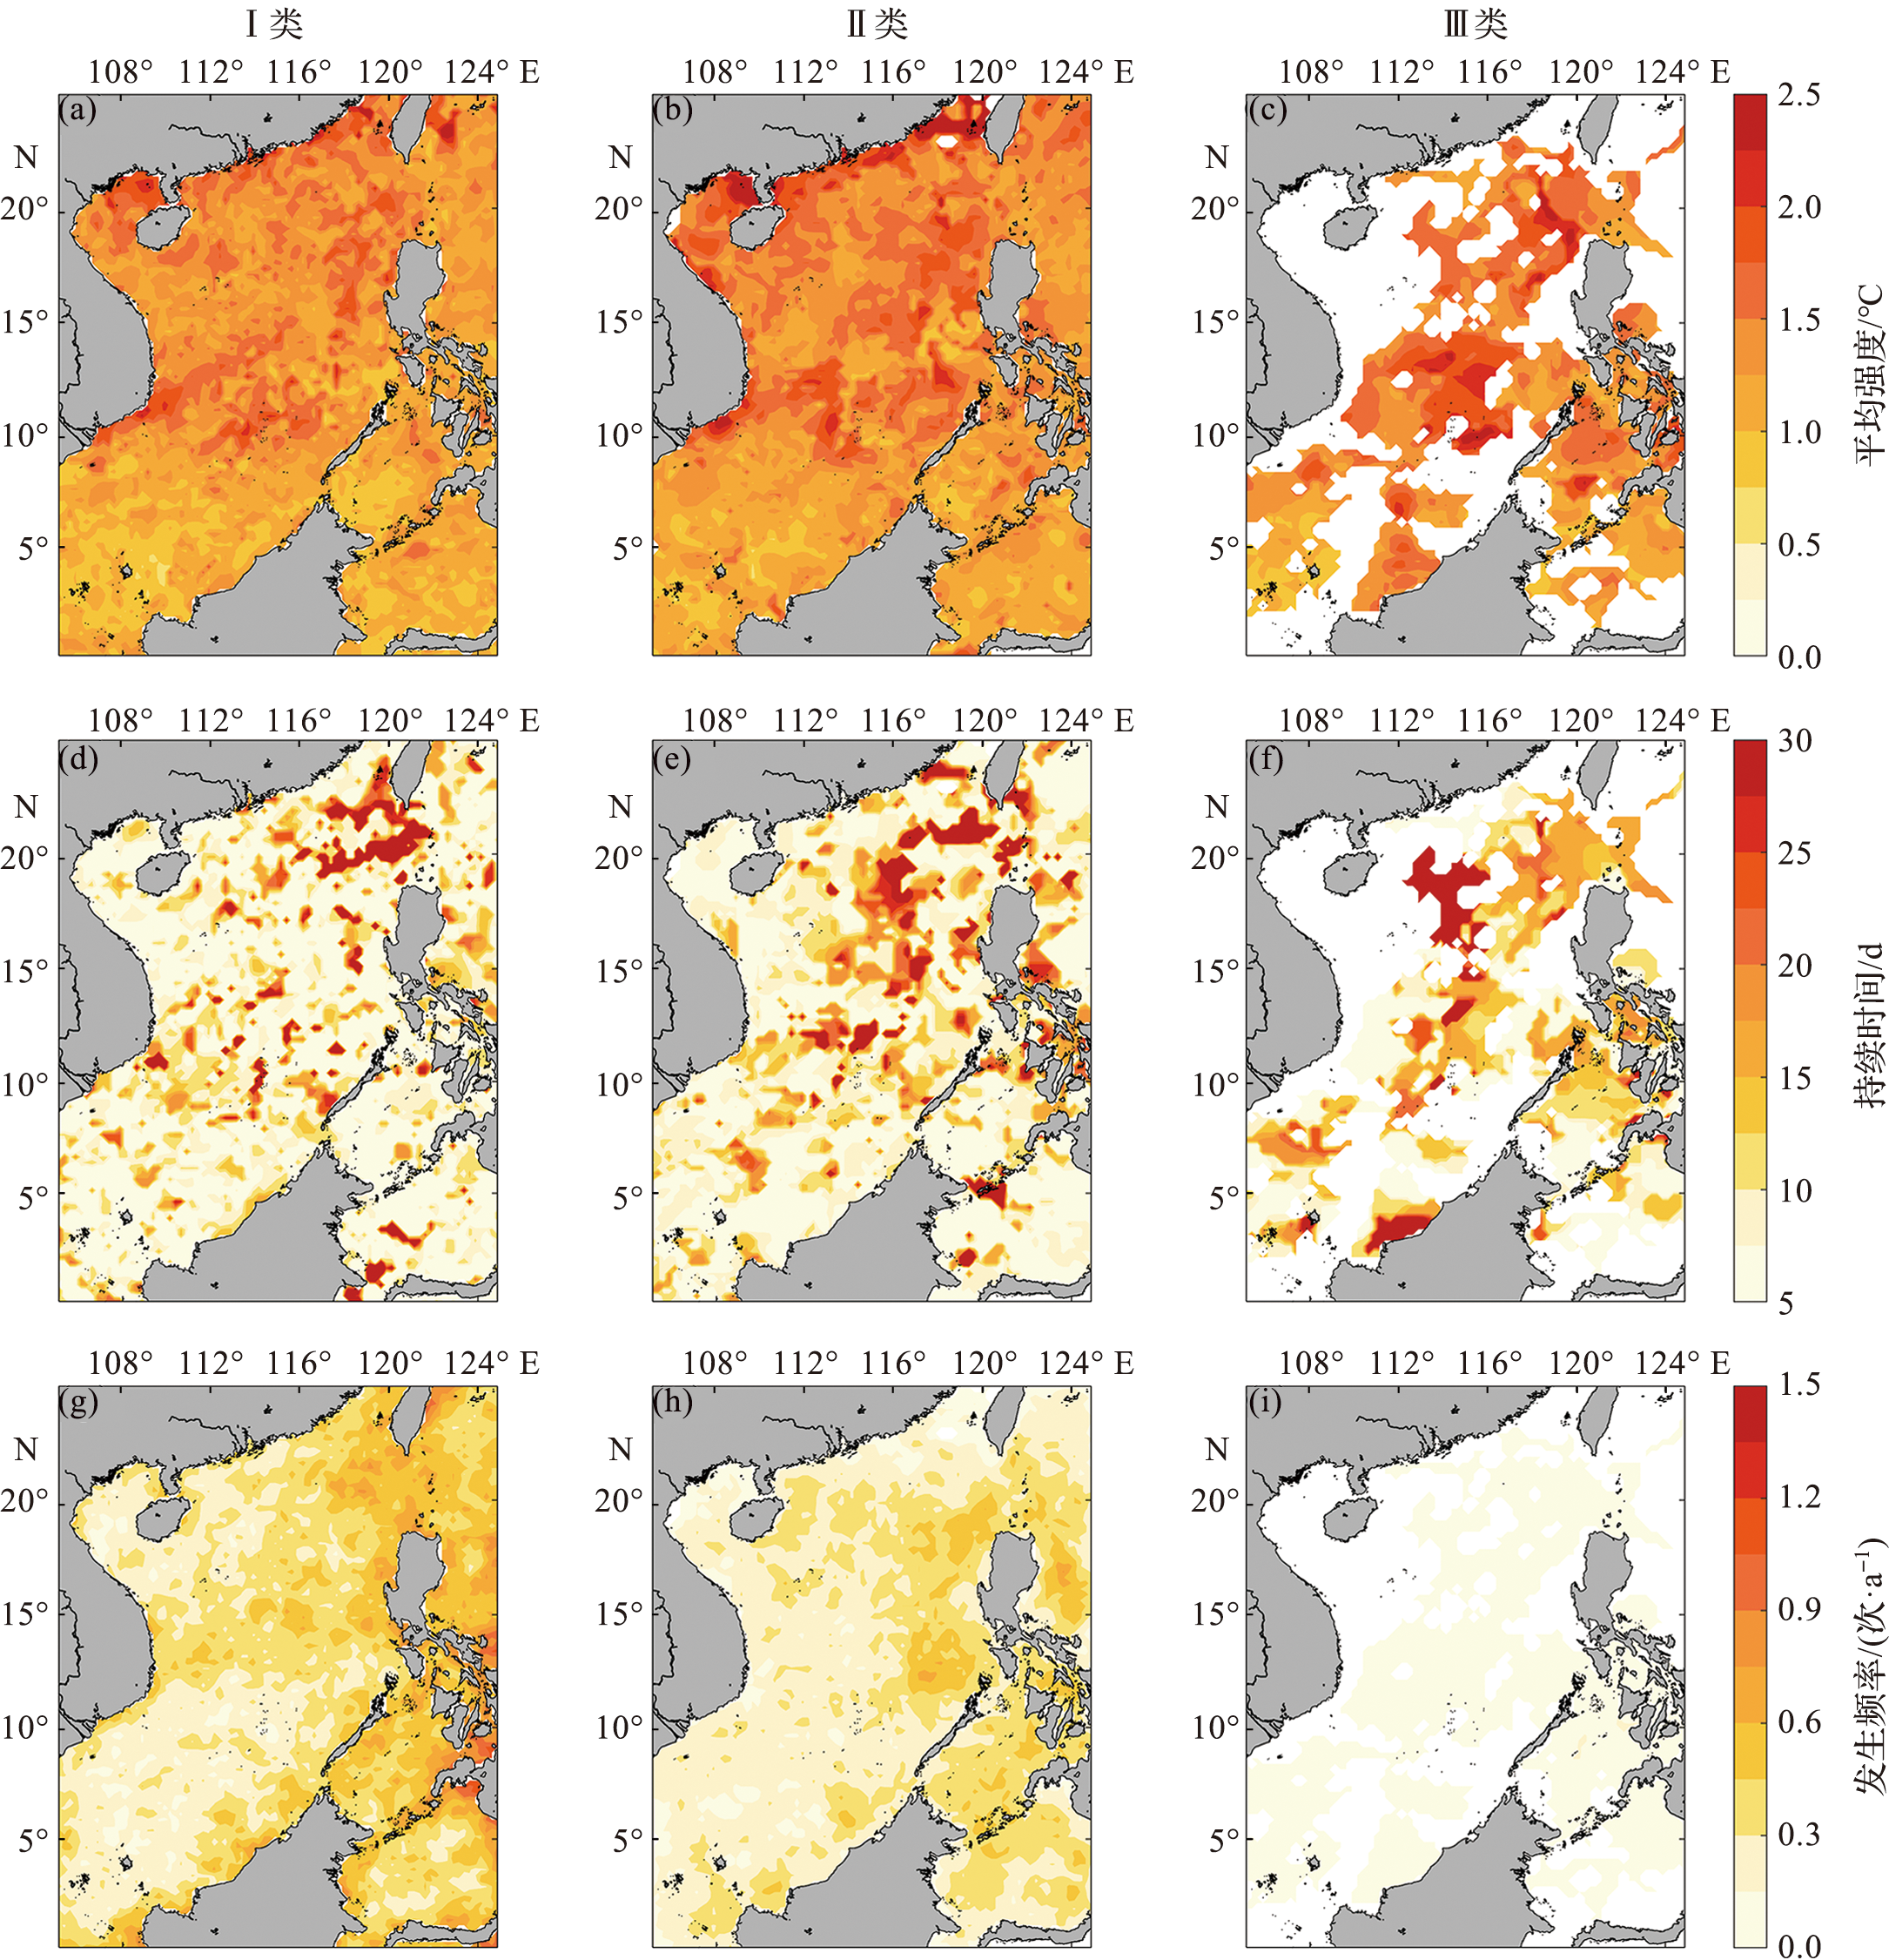
图10 拉尼娜事件期间南海三种类型海洋热浪的平均强度(a, b, c)、持续时间(d, e, f)以及发生频率(g, h, i)的空间分布
Fig.10 The distribution of mean intensity (a, b, c), duration (d, e, f), frequency (g, h, i) of three types of MHWs in the South China Sea during La Ni?a events
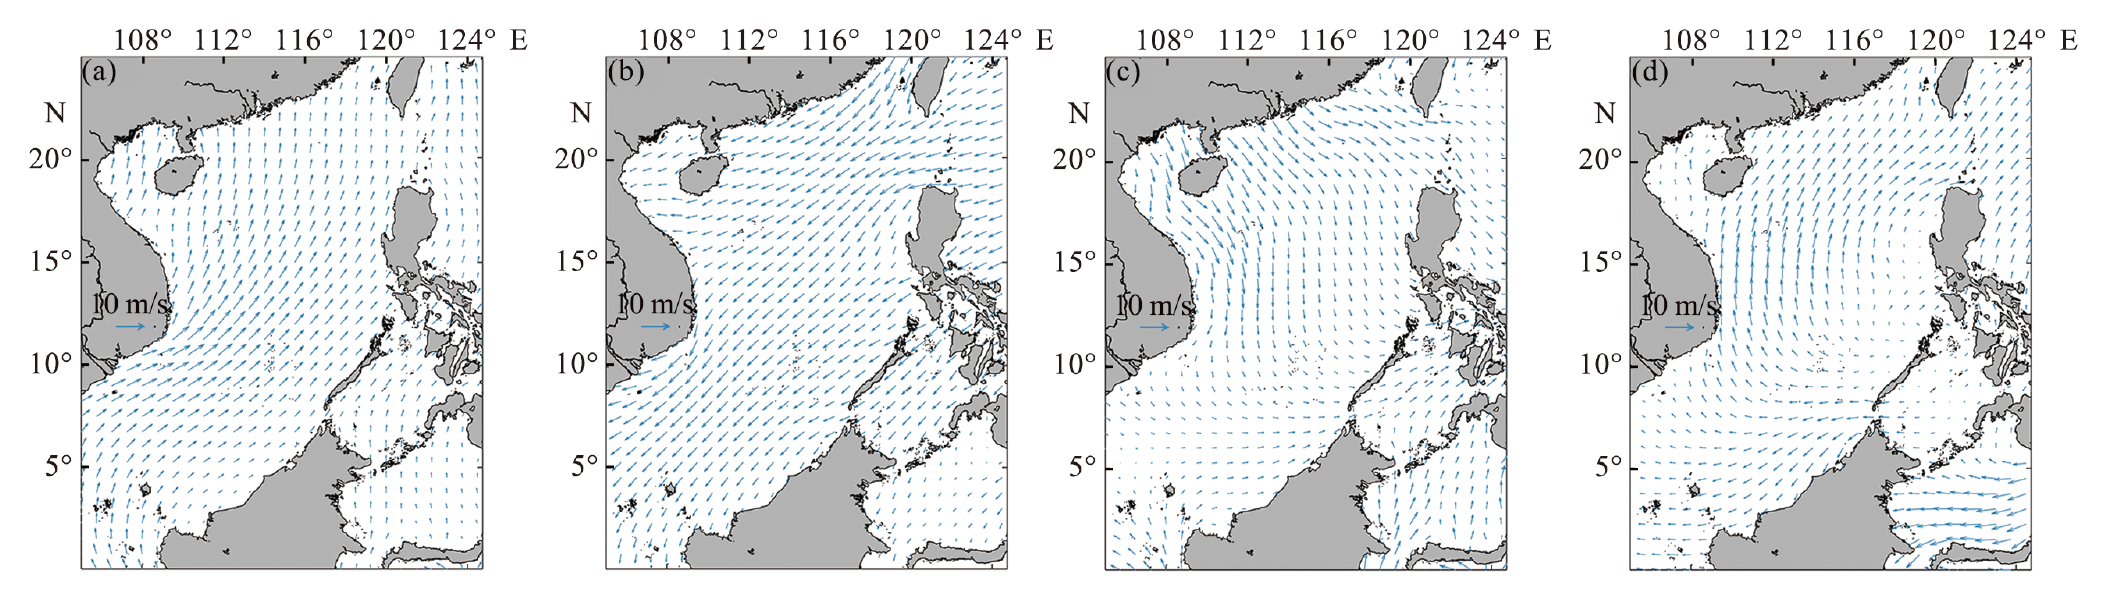
图11 气候态平均的南海夏季风场(a)和冬季风场(b);厄尔尼诺发生时期南海夏季(c)和冬季(d)相对于气候态平均的风场异常分布
Fig.11 The climatological mean surface wind vectors in summer (a) and winter (b); the anomalous surface wind vectors in summer (c) and winter (d) in the South China Sea during El Ni?o events
| [1] | STRAMMA L, SCHMIDTKO S, LEVIN L A, et al. Ocean oxygen minima expansions and their biological impacts[J]. Deep Sea Research Part I: Oceanographic Research Papers, 2010, 57(4): 587-595. |
| [2] | FIRTH L B, KNIGHTS A M, BELL S S. Air temperature and winter mortality: Implications for the persistence of the invasive mussel, Perna viridis in the intertidal zone of the south-eastern United States[J]. Journal of Experimental Marine Biology and Ecology, 2011, 400(1/2): 250-256. |
| [3] |
DI LORENZO E, MANTUA N. Multi-year persistence of the 2014/15 North Pacific marine heatwave[J]. Nature Climate Change, 2016, 6(11): 1042-1047.
DOI |
| [4] | HOBDAY A J, ALEXANDER L V, PERKINS S E, et al. A hierarchical approach to defining marine heatwaves[J]. Progress in Oceanography, 2016, 141: 227-238. |
| [5] |
CHEUNG W W L, FRÖLICHER T L. Marine heatwaves exacerbate climate change impacts for fisheries in the northeast Pacific[J]. Scientific Reports, 2020, 10(1): 6678.
DOI PMID |
| [6] | SMALE D A, WERNBERG T, OLIVER E C J, et al. Marine heatwaves threaten global biodiversity and the provision of ecosystem services[J]. Nature Climate Change, 2019, 9(4): 306-312. |
| [7] |
WERNBERG T, BENNETT S, BABCOCK R C, et al. Climate-driven regime shift of a temperate marine ecosystem[J]. Science, 2016, 353(6295): 169-172.
DOI PMID |
| [8] |
EAKIN C M, SWEATMAN H P A, BRAINARD R E. The 2014-2017 global-scale coral bleaching event: Insights and impacts[J]. Coral Reefs, 2019, 38(4): 539-545.
DOI |
| [9] |
MUNARI C. Effects of the 2003 European heatwave on the benthic community of a severe transitional ecosystem (Comacchio Saltworks, Italy)[J]. Marine Pollution Bulletin, 2011, 62(12): 2761-2770.
DOI PMID |
| [10] | FRÖLICHER T L, FISCHER E M, GRUBER N. Marine heatwaves under global warming[J]. Nature, 2018, 560(7718): 360-364. |
| [11] | CAVOLE L, DEMKO A, DINER R E, et al. Biological impacts of the 2013-2015 warm-water anomaly in the northeast Pacific: Winners, losers, and the future[J]. Oceanography, 2016, 29(2): 273-285. |
| [12] |
OLIVER E C J, DONAT M G, BURROWS M T, et al. Longer and more frequent marine heatwaves over the past century[J]. Nature Communications, 2018, 9(1): 1324.
DOI PMID |
| [13] | HOLBROOK N J, SEN GUPTA A, OLIVER E C J, et al. Keeping pace with marine heatwaves[J]. Nature Reviews Earth & Environment, 2020, 1(9): 482-493. |
| [14] | OLIVER E C J, BENTHUYSEN J A, DARMARAKI S, et al. Marine heatwaves[J]. Annual Review of Marine Science, 2021, 13(1): 313-342. |
| [15] |
胡石建, 李诗翰. 海洋热浪研究进展与展望[J]. 地球科学进展, 2022, 37(1):51-64.
DOI |
|
HU S J, LI S H. Progress and prospect of marine heatwave study[J]. Advances in Earth Science, 2022, 37(1): 51-64.
DOI |
|
| [16] |
HOLBROOK N J, SCANNELL H A, GUPTA A S, et al. A global assessment of marine heatwaves and their drivers[J]. Nature Communications, 2019, 10(1): 2624.
DOI PMID |
| [17] |
OLIVER E C J, BENTHUYSEN J A, BINDOFF N L, et al. The unprecedented 2015/16 Tasman Sea marine heatwave[J]. Nature Communications, 2017, 8: 16101.
DOI PMID |
| [18] | WERNBERG T, SMALE D A, TUYA F, et al. An extreme climatic event alters marine ecosystem structure in a global biodiversity hotspot[J]. Nature Climate Change, 2013, 3(1): 78-82. |
| [19] | MARBÀ N, JORDÀ G, AGUSTÍ S, et al. Footprints of climate change on Mediterranean Sea biota[J]. Frontiers in Marine Science, 2015, 2: 56. |
| [20] | OLITA A, SORGENTE R, NATALE S, et al. Effects of the 2003 European heatwave on the Central Mediterranean Sea: Surface fluxes and the dynamical response[J]. Ocean Science, 2007, 3(2): 273-289. |
| [21] | SUN D, JING Z, LI F R, et al. Characterizing global marine heatwaves under a spatio-temporal framework[J]. Progress in Oceanography, 2023, 211: 102947. |
| [22] |
GUPTA A S, THOMSEN M, BENTHUYSEN J A, et al. Drivers and impacts of the most extreme marine heatwaves events[J]. Scientific Reports, 2020, 10(1): 19359.
DOI PMID |
| [23] | YU K F. Coral reefs in the South China Sea: Their response to and records on past environmental changes[J]. Science China Earth Sciences, 2012, 55(8): 1217-1229. |
| [24] | FOX M D, COHEN A L, ROTJAN R D, et al. Increasing coral reef resilience through successive marine heatwaves[J]. Geophysical Research Letters, 2021, 48(17): e2021GL094128. |
| [25] | YAO Y L, WANG C Z. Variations in summer marine heatwaves in the South China sea[J]. Journal of Geophysical Research: Oceans, 2021, 126(10): e2021JC017792. |
| [26] | TAN H J, CAI R S, WU R G. Summer marine heatwaves in the South China Sea: Trend, variability and possible causes[J]. Advances in Climate Change Research, 2022, 13(3): 323-332. |
| [27] | 王爱梅, 王慧, 范文静, 等. 2019年中国近海海洋热浪特征研究[J]. 海洋学报, 2021, 43(6):35-44. |
| WANG A M, WANG H, FAN W J, et al. Study on characteristics of marine heatwave in the China offshore in 2019[J]. Haiyang Xuebao, 2021, 43(6): 35-44. | |
| [28] | LIU K, XU K, ZHU C W, et al. Diversity of marine heatwaves in the South China Sea regulated by the ENSO phase[J]. Journal of Climate, 2022, 35(2): 877-893. |
| [29] | REYNOLDS R W, SMITH T M, LIU C Y, et al. Daily high-resolution-blended analyses for sea surface temperature[J]. Journal of Climate, 2007, 20(22): 5473-5496. |
| [30] | DEE D P, UPPALA S M, SIMMONS A J, et al. The ERA-Interim reanalysis: Configuration and performance of the data assimilation system[J]. Quarterly Journal of the Royal Meteorological Society, 2011, 137(656): 553-597. |
| [31] | PEARCE A F, FENG M. The rise and fall of the “marine heat wave” off Western Australia during the summer of 2010/2011[J]. Journal of Marine Systems, 2013, 111: 139-156. |
| [32] | ZHAO Z J, MARIN M. A MATLAB toolbox to detect and analyze marine heatwaves[J]. Journal of Open Source Software, 2019, 4(33): 1124. |
| [33] | 龚建华. 深度优先搜索算法及其改进[J]. 现代电子技术, 2007, 30(55):90-92. |
| GONG J H. Depth-first search algorithm and its improvements[J]. Modern Electronics Technique, 2007, 30(55): 90-92. | |
| [34] | CHEN G X, HOU Y J, CHU X Q. Mesoscale eddies in the South China Sea: Mean properties, spatiotemporal variability, and impact on thermohaline structure[J]. Journal of Geophysical Research, 2011, 116(C6): C06018. |
| [35] | YU Y, ZHANG H R, JIN J B, et al. Trends of sea surface temperature and sea surface temperature fronts in the South China Sea during 2003-2017[J]. Acta Oceanologica Sinica, 2019, 38(4): 106-115. |
| [36] | LI S, YU K F, CHEN T R, et al. Assessment of coral bleaching using symbiotic zooxanthellae density and satellite remote sensing data in the Nansha Islands, South China Sea[J]. Chinese Science Bulletin, 2011, 56(10): 1031-1037. |
| [37] | XIE S P, XIE Q, WANG D X, et al. Summer upwelling in the South China Sea and its role in regional climate variations[J]. Journal of Geophysical Research: Oceans, 2003, 108(C8): 3261. |
| [38] | WANG D X, XIE Q, DU Y, et al. The 1997-1998 warm event in the South China Sea[J]. Chinese Science Bulletin, 2002, 47(14): 1221-1227. |
| [39] | WU R G, CHEN W, WANG G H, et al. Relative contribution of ENSO and East Asian winter monsoon to the South China Sea SST anomalies during ENSO decaying years[J]. Journal of Geophysical Research: Atmospheres, 2014, 119(9): 5046-5064. |
| [40] | FANG G H, CHEN H Y, WEI Z X, et al. Trends and interannual variability of the South China Sea surface winds, surface height, and surface temperature in the recent decade[J]. Journal of Geophysical Research: Oceans, 2006, 111(C11): C11S16. |
| [41] | LI L, GUO X G, WU R S. The winter western boundary current of the South China Sea: Physical structure and volume transport in December 1998[J]. Acta Oceanologica Sinica, 2018, 37(3): 1-7. |
| [42] | PARK Y G, CHOI A. Long-term changes of South China Sea surface temperatures in winter and summer[J]. Continental Shelf Research, 2017, 143: 185-193. |
| [43] | HOBDAY A J, OLIVER E C J, GUPTA A S, et al. Category and naming marine heateaves[J]. Oceanography Society, 2018, 31(2): 162-173. |
| [1] | 陈聪, 徐楚越, 秦箭煌, 康彦彦, 王桂芬. 2020—2023年“三重”拉尼娜期间热带太平洋上层海洋的时空差异[J]. 海洋学研究, 2024, 42(4): 12-20. |
| [2] | 刘佳, 郑少军, 严厉, 陈航彪, 刘婷甄. 南澳大利亚海盆表层涡动能的时空特征研究[J]. 海洋学研究, 2023, 41(3): 22-33. |
| [3] | 连涛, 何海伦. 西风爆发事件对暖池厄尔尼诺和冷舌厄尔尼诺的作用——一个概念模型得到的结果[J]. 海洋学研究, 2014, 32(3): 9-15. |
| 阅读次数 | ||||||
|
全文 |
|
|||||
|
摘要 |
|
|||||