Journal of Marine Sciences ›› 2024, Vol. 42 ›› Issue (4): 114-122.DOI: 10.3969/j.issn.1001-909X.2024.04.010
Previous Articles Next Articles
Research on spatio-temperal evolution of landscape pattern in island group——A case study of Dongtou Archipelago
HE Zhuoxi1( ), GUO Fenfen1,2, LAI Xianghua1,2,*(), HU Taojun1,2, CHEN Qingsong3
- 1. Second Institute of Oceanography, MNR, Hangzhou 310012, China
2. Key laboratory of Coastal Science and Integrated Management, MNR, Hangzhou 310012, China
3. Dongtou Branch Bureau of Wenzhou Natural Resources and Planning Bureau, Wenzhou 325799, China
-
Received:2024-02-21Revised:2024-06-07Online:2024-12-15Published:2025-02-08 -
Contact:LAI Xianghua
CLC Number:
Cite this article
HE Zhuoxi, GUO Fenfen, LAI Xianghua, HU Taojun, CHEN Qingsong. Research on spatio-temperal evolution of landscape pattern in island group——A case study of Dongtou Archipelago[J]. Journal of Marine Sciences, 2024, 42(4): 114-122.
share this article
Add to citation manager EndNote|Ris|BibTeX
URL: http://hyxyj.sio.org.cn/EN/10.3969/j.issn.1001-909X.2024.04.010
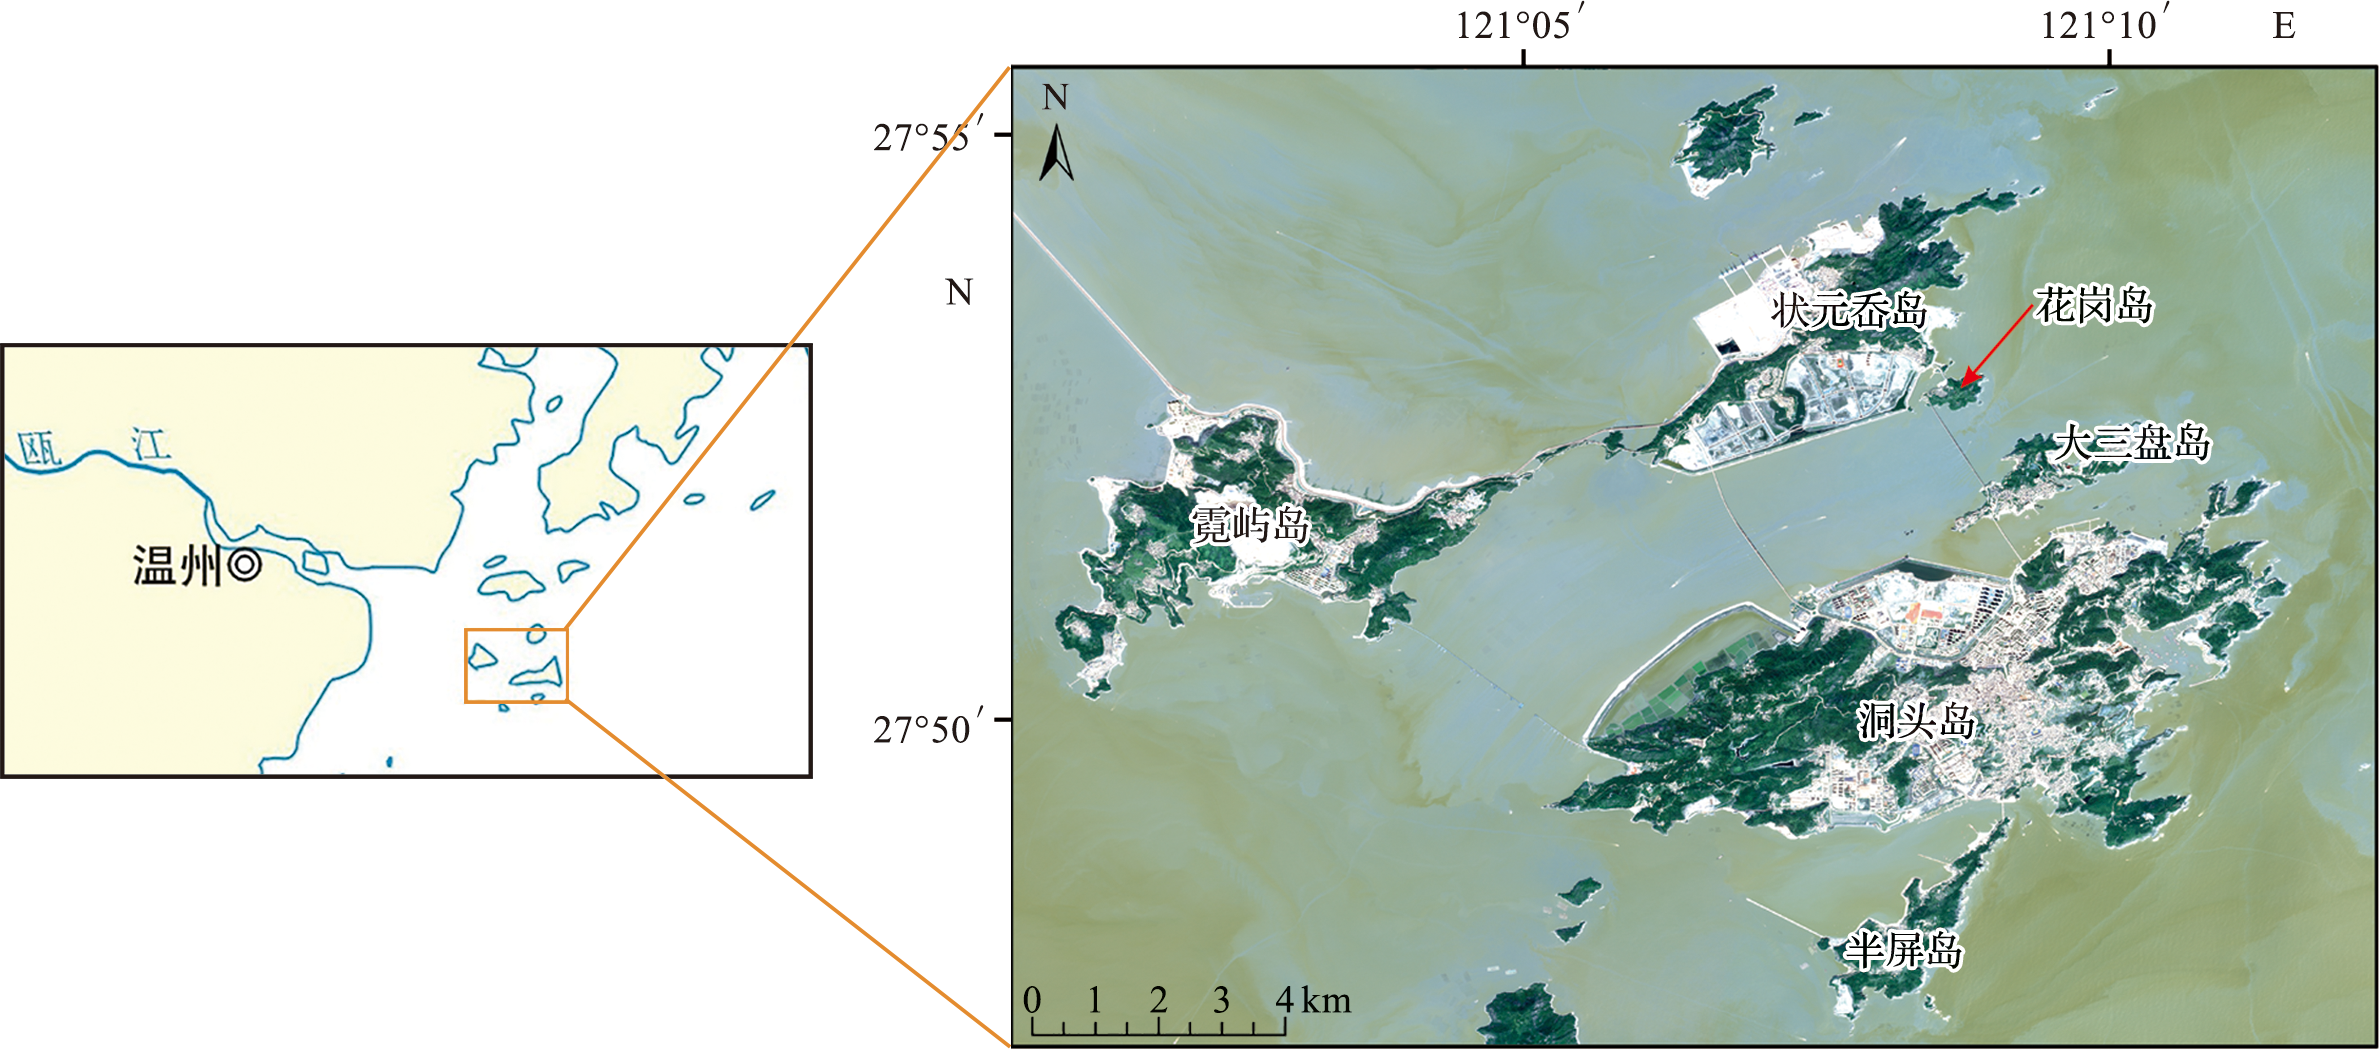
Fig.1 The location of the study area
| 影像数据 | 成像时间 | 空间分 辨率/m | 数据来源 |
|---|---|---|---|
| 1∶10 000数字正射 影像图(DOM) | 2008-08-21 | 0.8 | 浙江省测绘 资料档案馆 |
| 1∶10 000数字正射 影像图(DOM) | 2014-12-16 | 0.5 | 浙江省测绘 资料档案馆 |
| 资源三号(ZY-3)卫星 | 2018-02-11 | 1.5 | 中国资源卫星 应用中心 |
| 高分六号(GF-6)光学卫星 | 2022-09-15 | 2.0 | 中国资源卫星 应用中心 |
Tab.1 Remote sensing images information
| 影像数据 | 成像时间 | 空间分 辨率/m | 数据来源 |
|---|---|---|---|
| 1∶10 000数字正射 影像图(DOM) | 2008-08-21 | 0.8 | 浙江省测绘 资料档案馆 |
| 1∶10 000数字正射 影像图(DOM) | 2014-12-16 | 0.5 | 浙江省测绘 资料档案馆 |
| 资源三号(ZY-3)卫星 | 2018-02-11 | 1.5 | 中国资源卫星 应用中心 |
| 高分六号(GF-6)光学卫星 | 2022-09-15 | 2.0 | 中国资源卫星 应用中心 |
| 景观类别 | 影像解译标志 | 分类说明 | 景观类别 | 影像解译标志 | 分类说明 |
|---|---|---|---|---|---|
| 林地 |  | 大片的、聚集的山地植被 | 工矿用地 |  | 工矿业生产用地 |
| 草地 |  | 以草本植物为主的土地 | 道路 | 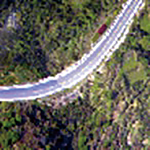 | 公路、城市道路和允许社会机动车通行的路 |
| 耕地 | 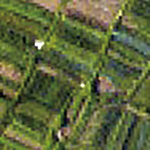 | 种植、耕种的土地 | 水域 | 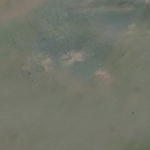 | 湖泊、池塘以及河流等水体 |
| 建筑用地 | 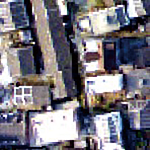 | 居民点、商业区以及人工建筑用地 | 未利用土地 |  | 裸露的沙地以及未开发利用的土地 |
Tab.2 Landscape types and image interpretation markers in the study area
| 景观类别 | 影像解译标志 | 分类说明 | 景观类别 | 影像解译标志 | 分类说明 |
|---|---|---|---|---|---|
| 林地 | | 大片的、聚集的山地植被 | 工矿用地 | | 工矿业生产用地 |
| 草地 | | 以草本植物为主的土地 | 道路 | | 公路、城市道路和允许社会机动车通行的路 |
| 耕地 | | 种植、耕种的土地 | 水域 | | 湖泊、池塘以及河流等水体 |
| 建筑用地 | | 居民点、商业区以及人工建筑用地 | 未利用土地 | | 裸露的沙地以及未开发利用的土地 |
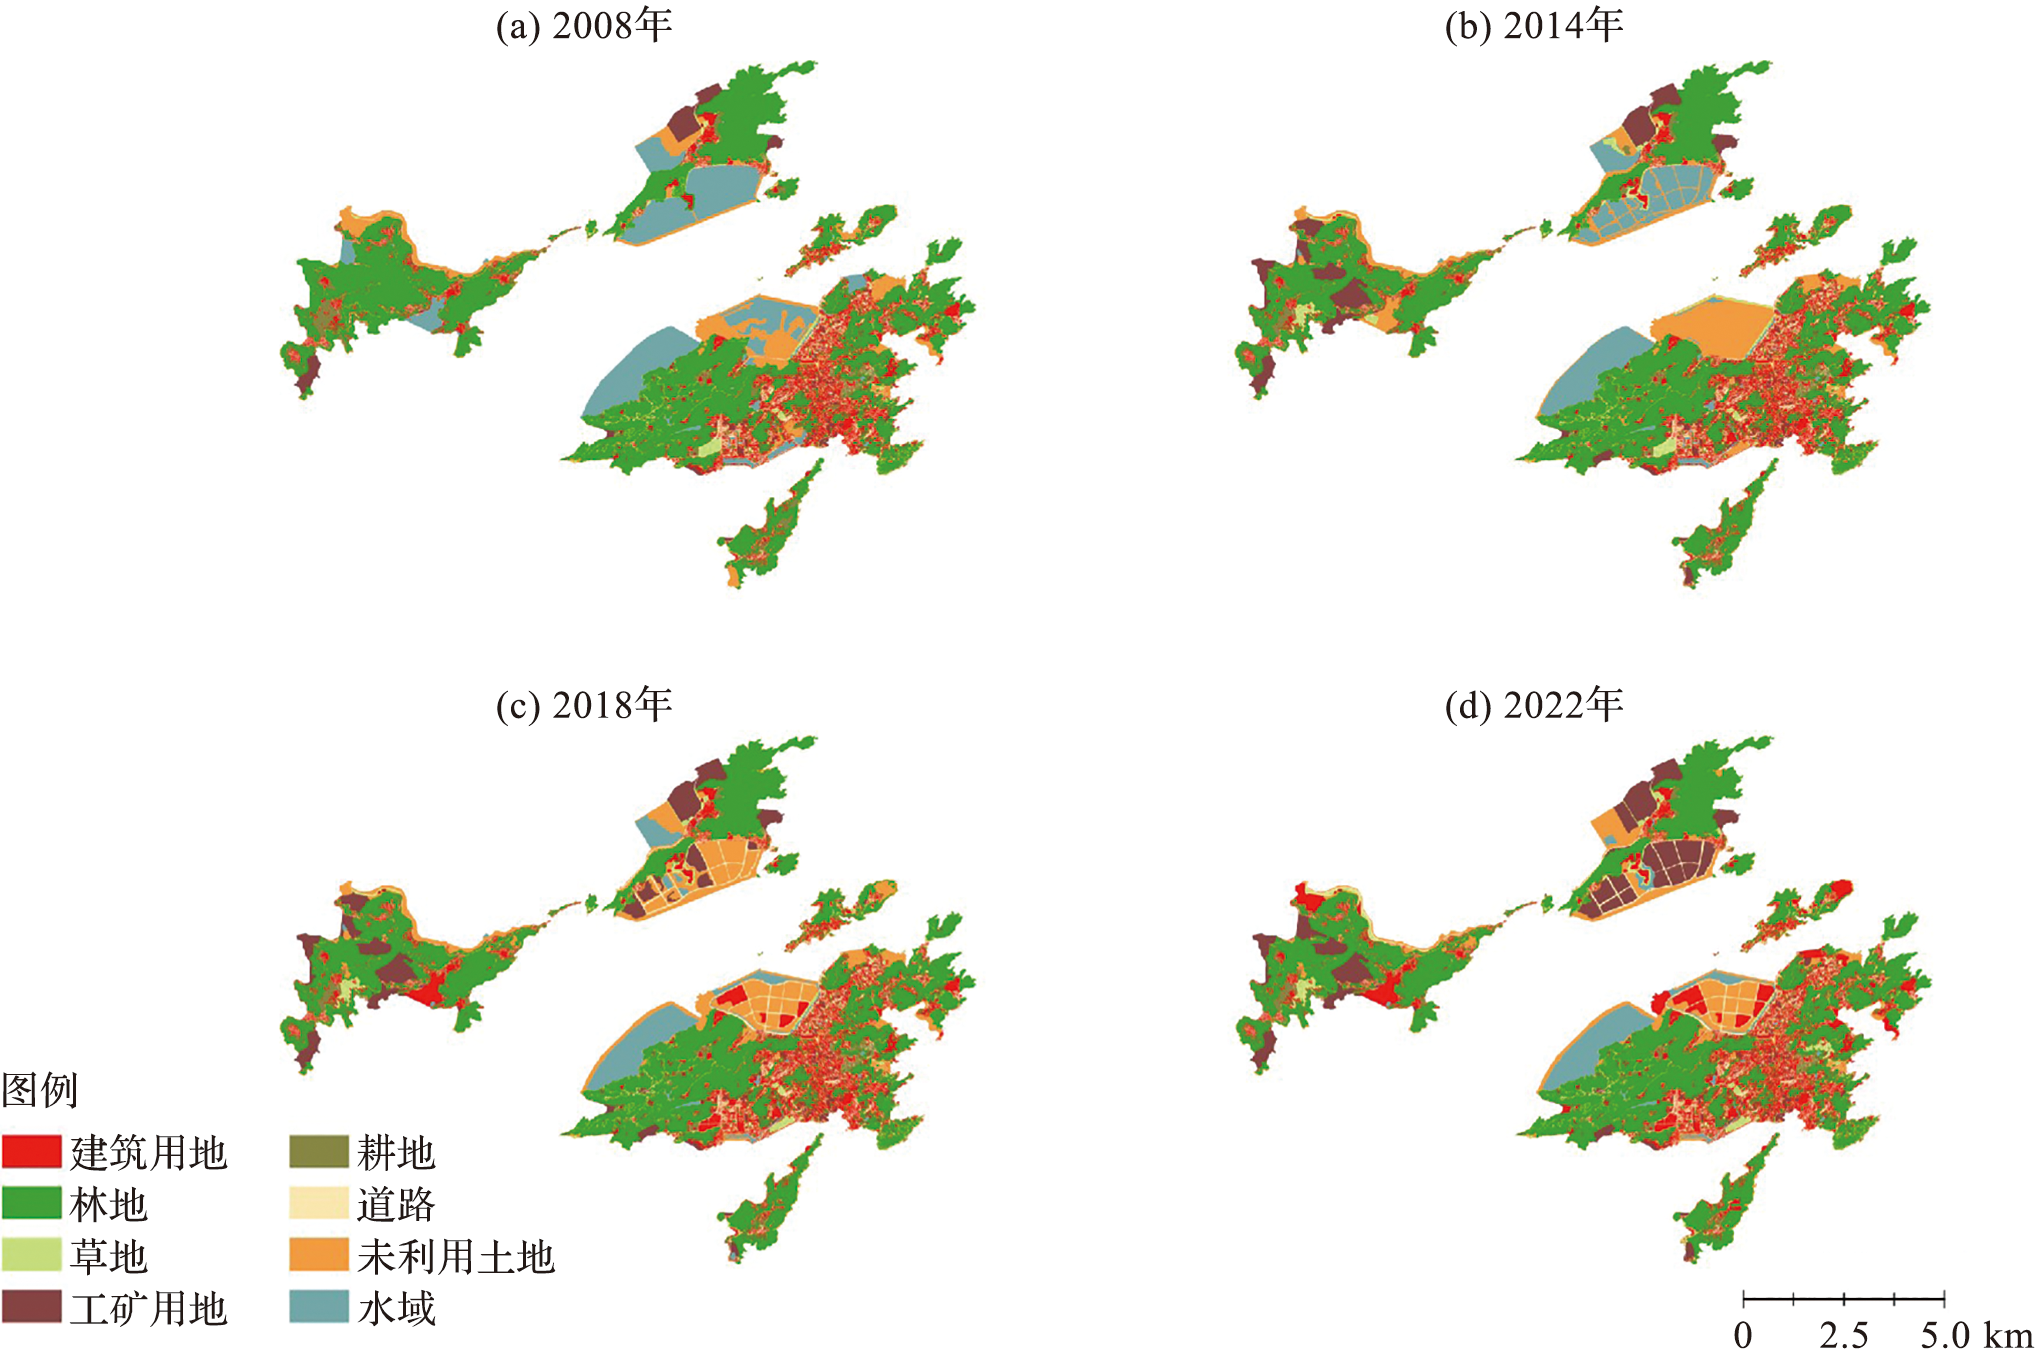
Fig.2 landscape types of Dongtou island group in 2008,2014,2018 and 2022
| 景观指数 | 年份 | 景观类型 | ||||||||
|---|---|---|---|---|---|---|---|---|---|---|
| 草地 | 道路 | 耕地 | 工矿用地 | 建筑用地 | 林地 | 水域 | 未利用土地 | |||
| 斑块面积百分比/% | 2008年 | 1.94 | 6.08 | 4.00 | 3.20 | 11.76 | 49.23 | 14.81 | 8.98 | |
| 2014年 | 2.99 | 6.39 | 3.58 | 6.86 | 12.41 | 46.33 | 9.83 | 11.60 | ||
| 2018年 | 2.52 | 7.65 | 3.19 | 8.07 | 14.11 | 45.90 | 5.56 | 13.00 | ||
| 2022年 | 2.93 | 7.82 | 2.91 | 10.79 | 16.26 | 45.75 | 4.79 | 8.76 | ||
| 最大斑块指数/% | 2008年 | 0.25 | 0.23 | 0.53 | 0.79 | 1.78 | 12.60 | 4.07 | 3.11 | |
| 2014年 | 0.28 | 0.25 | 0.28 | 0.95 | 1.78 | 12.33 | 3.91 | 4.93 | ||
| 2018年 | 0.28 | 0.72 | 0.28 | 0.95 | 1.78 | 12.15 | 3.37 | 1.09 | ||
| 2022年 | 0.28 | 0.72 | 0.28 | 0.95 | 1.78 | 12.19 | 3.37 | 1.06 | ||
| 斑块密度 /(个·km-2) | 2008年 | 120.57 | 262.06 | 136.58 | 28.93 | 271.69 | 18.94 | 1.58 | 74.12 | |
| 2014年 | 125.13 | 268.86 | 143.05 | 29.85 | 280.32 | 19.32 | 1.48 | 79.88 | ||
| 2018年 | 124.34 | 268.07 | 142.22 | 29.92 | 274.94 | 19.06 | 1.26 | 81.02 | ||
| 2022年 | 122.76 | 267.39 | 142.85 | 29.77 | 270.16 | 19.03 | 1.19 | 80.84 | ||
Tab.3 Landscape pattern indices of Dongtou island group from 2008 to 2022
| 景观指数 | 年份 | 景观类型 | ||||||||
|---|---|---|---|---|---|---|---|---|---|---|
| 草地 | 道路 | 耕地 | 工矿用地 | 建筑用地 | 林地 | 水域 | 未利用土地 | |||
| 斑块面积百分比/% | 2008年 | 1.94 | 6.08 | 4.00 | 3.20 | 11.76 | 49.23 | 14.81 | 8.98 | |
| 2014年 | 2.99 | 6.39 | 3.58 | 6.86 | 12.41 | 46.33 | 9.83 | 11.60 | ||
| 2018年 | 2.52 | 7.65 | 3.19 | 8.07 | 14.11 | 45.90 | 5.56 | 13.00 | ||
| 2022年 | 2.93 | 7.82 | 2.91 | 10.79 | 16.26 | 45.75 | 4.79 | 8.76 | ||
| 最大斑块指数/% | 2008年 | 0.25 | 0.23 | 0.53 | 0.79 | 1.78 | 12.60 | 4.07 | 3.11 | |
| 2014年 | 0.28 | 0.25 | 0.28 | 0.95 | 1.78 | 12.33 | 3.91 | 4.93 | ||
| 2018年 | 0.28 | 0.72 | 0.28 | 0.95 | 1.78 | 12.15 | 3.37 | 1.09 | ||
| 2022年 | 0.28 | 0.72 | 0.28 | 0.95 | 1.78 | 12.19 | 3.37 | 1.06 | ||
| 斑块密度 /(个·km-2) | 2008年 | 120.57 | 262.06 | 136.58 | 28.93 | 271.69 | 18.94 | 1.58 | 74.12 | |
| 2014年 | 125.13 | 268.86 | 143.05 | 29.85 | 280.32 | 19.32 | 1.48 | 79.88 | ||
| 2018年 | 124.34 | 268.07 | 142.22 | 29.92 | 274.94 | 19.06 | 1.26 | 81.02 | ||
| 2022年 | 122.76 | 267.39 | 142.85 | 29.77 | 270.16 | 19.03 | 1.19 | 80.84 | ||
| 岛名 | 指数 | 年份 | 景观类型 | ||||||||
|---|---|---|---|---|---|---|---|---|---|---|---|
| 草地 | 道路 | 耕地 | 工矿用地 | 建筑用地 | 林地 | 水域 | 未利用土地 | ||||
| 洞头岛 | 斑块面积百分比/% | 2008年 | 2.40 | 7.93 | 3.74 | 2.12 | 15.35 | 44.55 | 14.31 | 9.60 | |
| 2022年 | 2.59 | 9.46 | 3.29 | 2.55 | 20.43 | 43.95 | 8.26 | 9.47 | |||
| 最大斑块指数/% | 2008年 | 0.47 | 0.40 | 0.37 | 0.22 | 3.49 | 23.67 | 7.65 | 5.84 | ||
| 2022年 | 0.31 | 1.19 | 0.37 | 0.37 | 3.55 | 22.89 | 6.33 | 1.51 | |||
| 斑块密度/(个·km-2) | 2008年 | 38.17 | 325.72 | 170.47 | 12.76 | 309.67 | 8.90 | 1.85 | 85.20 | ||
| 2022年 | 38.90 | 331.27 | 178.89 | 14.07 | 307.94 | 9.06 | 1.79 | 91.52 | |||
| 霓屿岛 | 斑块面积百分比/% | 2008年 | 0.84 | 4.56 | 5.81 | 3.30 | 8.20 | 64.09 | 5.01 | 8.19 | |
| 2022年 | 3.40 | 5.54 | 3.82 | 15.29 | 13.88 | 53.26 | 0.18 | 4.62 | |||
| 最大斑块指数/% | 2008年 | 0.06 | 0.18 | 2.44 | 2.37 | 0.58 | 44.05 | 3.23 | 7.22 | ||
| 2022年 | 1.37 | 1.04 | 1.24 | 4.06 | 3.35 | 30.67 | 0.13 | 1.85 | |||
| 斑块密度/(个·km-2) | 2008年 | 200.76 | 261.71 | 166.26 | 84.17 | 329.21 | 59.54 | 1.74 | 31.35 | ||
| 2022年 | 199.93 | 261.63 | 173.81 | 82.18 | 324.82 | 61.12 | 0.50 | 34.58 | |||
| 状元岙岛 | 斑块面积百分比/% | 2008年 | 1.19 | 2.25 | 1.09 | 7.30 | 5.14 | 41.75 | 33.36 | 7.92 | |
| 2022年 | 2.65 | 5.91 | 0.76 | 32.98 | 5.72 | 37.05 | 1.90 | 13.02 | |||
| 最大斑块指数/% | 2008年 | 0.27 | 0.35 | 0.80 | 6.15 | 1.71 | 31.29 | 16.51 | 3.64 | ||
| 2022年 | 0.76 | 3.87 | 0.40 | 8.13 | 2.31 | 29.02 | 1.17 | 5.76 | |||
| 斑块密度/(个·km-2) | 2008年 | 131.87 | 71.84 | 10.88 | 7.65 | 69.99 | 5.72 | 1.29 | 40.76 | ||
| 2022年 | 130.03 | 69.90 | 11.16 | 8.30 | 68.79 | 4.15 | 1.11 | 45.00 | |||
| 半屏岛 | 斑块面积百分比/% | 2008年 | 2.49 | 5.73 | 12.56 | 0.94 | 9.13 | 62.01 | 0.03 | 7.10 | |
| 2022年 | 3.79 | 5.99 | 5.21 | 3.04 | 11.60 | 65.94 | 0.00 | 4.43 | |||
| 最大斑块指数/% | 2008年 | 0.32 | 2.16 | 2.60 | 0.60 | 0.54 | 59.03 | 0.03 | 4.63 | ||
| 2022年 | 0.94 | 2.16 | 1.08 | 0.66 | 2.35 | 64.03 | 0.00 | 3.53 | |||
| 斑块密度/(个·km-2) | 2008年 | 353.70 | 245.24 | 245.24 | 42.09 | 416.02 | 13.76 | 0.40 | 25.09 | ||
| 2022年 | 368.67 | 267.10 | 254.15 | 21.45 | 411.17 | 7.69 | 0.00 | 42.49 | |||
| 大三盘岛 | 斑块面积百分比/% | 2008年 | 4.44 | 8.34 | 1.15 | 0.43 | 17.74 | 54.61 | 0.67 | 12.62 | |
| 2022年 | 6.13 | 9.59 | 0.66 | 0.93 | 31.43 | 44.24 | 0.18 | 6.84 | |||
| 最大斑块指数/% | 2008年 | 0.26 | 0.79 | 0.22 | 0.03 | 7.43 | 28.08 | 0.43 | 6.37 | ||
| 2022年 | 0.83 | 0.81 | 0.05 | 0.35 | 10.86 | 21.27 | 0.10 | 0.65 | |||
| 斑块密度/(个·km-2) | 2008年 | 613.31 | 464.02 | 40.35 | 51.88 | 307.23 | 26.52 | 1.73 | 441.54 | ||
| 2022年 | 685.36 | 523.39 | 33.43 | 66.29 | 341.24 | 28.24 | 1.15 | 517.62 | |||
| 花岗岛 | 斑块面积百分比/% | 2008年 | 2.52 | 2.04 | 13.11 | 0.00 | 7.51 | 66.90 | 0.27 | 7.67 | |
| 2022年 | 2.21 | 2.04 | 0.00 | 0.00 | 10.39 | 79.42 | 0.00 | 5.94 | |||
| 最大斑块指数/% | 2008年 | 0.89 | 2.02 | 13.11 | 0.00 | 5.22 | 63.85 | 1.79 | 0.17 | ||
| 2022年 | 0.60 | 2.02 | 0.00 | 0.00 | 6.60 | 76.37 | 1.43 | 0.00 | |||
| 斑块密度/(个·km-2) | 2008年 | 31.94 | 9.58 | 3.19 | 0.00 | 47.91 | 15.97 | 6.39 | 140.53 | ||
| 2022年 | 31.94 | 9.58 | 0.00 | 0.00 | 47.91 | 15.97 | 0.00 | 143.72 | |||
Tab.4 Landscape pattern indices of six islands in 2008 and 2022
| 岛名 | 指数 | 年份 | 景观类型 | ||||||||
|---|---|---|---|---|---|---|---|---|---|---|---|
| 草地 | 道路 | 耕地 | 工矿用地 | 建筑用地 | 林地 | 水域 | 未利用土地 | ||||
| 洞头岛 | 斑块面积百分比/% | 2008年 | 2.40 | 7.93 | 3.74 | 2.12 | 15.35 | 44.55 | 14.31 | 9.60 | |
| 2022年 | 2.59 | 9.46 | 3.29 | 2.55 | 20.43 | 43.95 | 8.26 | 9.47 | |||
| 最大斑块指数/% | 2008年 | 0.47 | 0.40 | 0.37 | 0.22 | 3.49 | 23.67 | 7.65 | 5.84 | ||
| 2022年 | 0.31 | 1.19 | 0.37 | 0.37 | 3.55 | 22.89 | 6.33 | 1.51 | |||
| 斑块密度/(个·km-2) | 2008年 | 38.17 | 325.72 | 170.47 | 12.76 | 309.67 | 8.90 | 1.85 | 85.20 | ||
| 2022年 | 38.90 | 331.27 | 178.89 | 14.07 | 307.94 | 9.06 | 1.79 | 91.52 | |||
| 霓屿岛 | 斑块面积百分比/% | 2008年 | 0.84 | 4.56 | 5.81 | 3.30 | 8.20 | 64.09 | 5.01 | 8.19 | |
| 2022年 | 3.40 | 5.54 | 3.82 | 15.29 | 13.88 | 53.26 | 0.18 | 4.62 | |||
| 最大斑块指数/% | 2008年 | 0.06 | 0.18 | 2.44 | 2.37 | 0.58 | 44.05 | 3.23 | 7.22 | ||
| 2022年 | 1.37 | 1.04 | 1.24 | 4.06 | 3.35 | 30.67 | 0.13 | 1.85 | |||
| 斑块密度/(个·km-2) | 2008年 | 200.76 | 261.71 | 166.26 | 84.17 | 329.21 | 59.54 | 1.74 | 31.35 | ||
| 2022年 | 199.93 | 261.63 | 173.81 | 82.18 | 324.82 | 61.12 | 0.50 | 34.58 | |||
| 状元岙岛 | 斑块面积百分比/% | 2008年 | 1.19 | 2.25 | 1.09 | 7.30 | 5.14 | 41.75 | 33.36 | 7.92 | |
| 2022年 | 2.65 | 5.91 | 0.76 | 32.98 | 5.72 | 37.05 | 1.90 | 13.02 | |||
| 最大斑块指数/% | 2008年 | 0.27 | 0.35 | 0.80 | 6.15 | 1.71 | 31.29 | 16.51 | 3.64 | ||
| 2022年 | 0.76 | 3.87 | 0.40 | 8.13 | 2.31 | 29.02 | 1.17 | 5.76 | |||
| 斑块密度/(个·km-2) | 2008年 | 131.87 | 71.84 | 10.88 | 7.65 | 69.99 | 5.72 | 1.29 | 40.76 | ||
| 2022年 | 130.03 | 69.90 | 11.16 | 8.30 | 68.79 | 4.15 | 1.11 | 45.00 | |||
| 半屏岛 | 斑块面积百分比/% | 2008年 | 2.49 | 5.73 | 12.56 | 0.94 | 9.13 | 62.01 | 0.03 | 7.10 | |
| 2022年 | 3.79 | 5.99 | 5.21 | 3.04 | 11.60 | 65.94 | 0.00 | 4.43 | |||
| 最大斑块指数/% | 2008年 | 0.32 | 2.16 | 2.60 | 0.60 | 0.54 | 59.03 | 0.03 | 4.63 | ||
| 2022年 | 0.94 | 2.16 | 1.08 | 0.66 | 2.35 | 64.03 | 0.00 | 3.53 | |||
| 斑块密度/(个·km-2) | 2008年 | 353.70 | 245.24 | 245.24 | 42.09 | 416.02 | 13.76 | 0.40 | 25.09 | ||
| 2022年 | 368.67 | 267.10 | 254.15 | 21.45 | 411.17 | 7.69 | 0.00 | 42.49 | |||
| 大三盘岛 | 斑块面积百分比/% | 2008年 | 4.44 | 8.34 | 1.15 | 0.43 | 17.74 | 54.61 | 0.67 | 12.62 | |
| 2022年 | 6.13 | 9.59 | 0.66 | 0.93 | 31.43 | 44.24 | 0.18 | 6.84 | |||
| 最大斑块指数/% | 2008年 | 0.26 | 0.79 | 0.22 | 0.03 | 7.43 | 28.08 | 0.43 | 6.37 | ||
| 2022年 | 0.83 | 0.81 | 0.05 | 0.35 | 10.86 | 21.27 | 0.10 | 0.65 | |||
| 斑块密度/(个·km-2) | 2008年 | 613.31 | 464.02 | 40.35 | 51.88 | 307.23 | 26.52 | 1.73 | 441.54 | ||
| 2022年 | 685.36 | 523.39 | 33.43 | 66.29 | 341.24 | 28.24 | 1.15 | 517.62 | |||
| 花岗岛 | 斑块面积百分比/% | 2008年 | 2.52 | 2.04 | 13.11 | 0.00 | 7.51 | 66.90 | 0.27 | 7.67 | |
| 2022年 | 2.21 | 2.04 | 0.00 | 0.00 | 10.39 | 79.42 | 0.00 | 5.94 | |||
| 最大斑块指数/% | 2008年 | 0.89 | 2.02 | 13.11 | 0.00 | 5.22 | 63.85 | 1.79 | 0.17 | ||
| 2022年 | 0.60 | 2.02 | 0.00 | 0.00 | 6.60 | 76.37 | 1.43 | 0.00 | |||
| 斑块密度/(个·km-2) | 2008年 | 31.94 | 9.58 | 3.19 | 0.00 | 47.91 | 15.97 | 6.39 | 140.53 | ||
| 2022年 | 31.94 | 9.58 | 0.00 | 0.00 | 47.91 | 15.97 | 0.00 | 143.72 | |||

Fig.3 Contribution of landscape type for each island to the landscape pattern of Dongtou island group in different periods
| [1] | PEREIRA M T, JULIANA L, MARIA I A. A systemic environmental impact assessment on tourism in island and coastal ecosystems[J]. Environmental Development, 2022, 44: 100765. |
| [2] | YANG J, YAN F, CHEN M X. Effects of sea level rise on storm surges in the south Yellow Sea: A case study of Typhoon Muifa (2011)[J]. Continental Shelf Research, 2021, 215: 104346. |
| [3] | ZHANG H, XIAO Y, DENG Y Z. Island ecosystem evaluation and sustainable development strategies: A case study of the Zhoushan Archipelago[J]. Global Ecology and Conservation, 2021, 28: e01603. |
| [4] | LEYVA C, ESPEJEL I, ESCOFET A, et al. Coastal landscape fragmentation by tourism development: Impacts and conser-vation alternatives[J]. Natural Areas Journal, 2006, 26(2): 117-125. |
| [5] | RODRIGUES E, COHEN M C L, LIU K B, et al. The effect of global warming on the establishment of mangroves in coastal Louisiana during the Holocene[J]. Geomorphology, 2021, 381: 107648. |
| [6] | 徐晓然, 谢跟踪, 邱彭华. 1964—2015年海南省八门湾红树林湿地及其周边土地景观动态分析[J]. 生态学报, 2018, 38(20):7458-7468. |
| XU X R, XIE G Z, QIU P H. Dynamic analysis of landscape changes in Bamen Port and the surrounding lands of Hainan Province from 1964 to 2015[J]. Acta Ecologica Sinica, 2018, 38(20): 7458-7468. | |
| [7] | STEIBL S, GEBAUER G, LAFORSCH C. Impacts on food web properties of island invertebrate communities vary between different human land uses[J]. The Science of the Total Environment, 2022, 831: 154838. |
| [8] | YANG J, GE Y T, GE Q S, et al. Determinants of island tourism development: The example of Dachangshan Island[J]. Tourism Management, 2016, 55: 261-271. |
| [9] | XI H H, CUI W L, CAI L, et al. Evaluation and prediction of ecosystem service value in the Zhoushan Islands based on LUCC[J]. Sustainability, 2021, 13(4): 2302. |
| [10] | 魏静, 刘丽丽, 王红云, 等. 1990—2020年太行山区土地利用景观格局时空变化[J]. 中国生态农业学报:中英文, 2022, 30(7):1123-1133. |
| WEI J, LIU L L, WANG H Y, et al. Spatiotemporal patterns of land-use change in the Taihang Mountain (1990-2020)[J]. Chinese Journal of Eco-Agriculture, 2022, 30(7): 1123-1133. | |
| [11] | 向芸芸, 杨辉, 陈培雄, 等. 基于生态适宜性评价的海洋生态系统管理:以温州市洞头区为例[J]. 应用海洋学学报, 2018, 37(4):551-559. |
| XIANG Y Y, YANG H, CHEN P X, et al. Management of marine ecosystem based on ecological suitability assessment with a case study in Dongtou district, Wenzhou city[J]. Journal of Applied Oceanography, 2018, 37(4): 551-559. | |
| [12] | MACHADO G M V, JABOR P M, COELHO A L N, et al. Geohistorical evolution and the new geological map of the city of Vitoria, ES, Brazil[J]. Ocean & Coastal Management, 2018, 151: 45-52. |
| [13] | 索安宁, 赵冬至, 张丰收, 等. 基于卫星遥感的长山群岛岛礁空间格局分析[J]. 海洋科学进展, 2010, 28(1):73-79. |
| SUO A N, ZHAO D Z, ZHANG F S, et al. Analysis of spatial pattern of Changshan Islands based on remote sensing[J]. Advances in Marine Science, 2010, 28(1): 73-79. | |
| [14] | 索安宁, 孙永光, 李滨勇, 等. 长山群岛植被景观健康评价[J]. 应用生态学报, 2015, 26(4):1034-1040. |
| SUO A N, SUN Y G, LI B Y, et al. Vegetation landscape health assessment in Changshan Archipelago, North Yellow Sea[J]. Chinese Journal of Applied Ecology, 2015, 26(4): 1034-1040. | |
| [15] | WANG D G, DOU Y J, SHI A Q, et al. Research on the evolution of island coastal wetland landscape pattern[J]. IOP Conference Series: Earth and Environmental Science, 2021, 787(1): 012053. |
| [16] | 樊超, 桂峰, 赵晟. 海岛城镇空间扩展及景观生态演变研究:以舟山为例[J]. 海洋通报, 2019, 38(4):447-454. |
| FAN C, GUI F, ZHAO S. Spatial characteristics of island urban expansion and landscape ecological evolution: A case of the Zhoushan Island[J]. Marine Science Bulletin, 2019, 38(4): 447-454. | |
| [17] | 池源, 石洪华, 王恩康, 等. 庙岛群岛北五岛景观格局特征及其生态效应[J]. 生态学报, 2017, 37(4):1270-1285. |
| CHI Y, SHI H H, WANG E K, et al. Landscape pattern characteristics and ecological effects on five northern islands of Miaodao Archipelago[J]. Acta Ecologica Sinica, 2017, 37(4): 1270-1285. | |
| [18] | CHI Y, SHI H H, ZHENG W, et al. Archipelagic landscape patterns and their ecological effects in multiple scales[J]. Ocean & Coastal Management, 2018, 152: 120-134. |
| [19] | CHI Y, LIU D H, WANG C J, et al. Island development suitability evaluation for supporting the spatial planning in archipelagic areas[J]. Science of the Total Environment, 2022, 829: 154679. |
| [20] | CHI Y, ZHANG Z W, XIE Z L, et al. How human activities influence the island ecosystem through damaging the natural ecosystem and supporting the social ecosystem?[J]. Journal of Cleaner Production, 2020, 248: 119203. |
| [21] | QU Y B, CHI Y, GAO J H, et al. Measuring the multi-scale landscape pattern of China’s largest archipelago from a dual-3D perspective based on remote sensing[J]. Remote Sensing, 2023, 15(24): 5627. |
| [22] | 张耀光, 张岩, 刘桓. 海岛(县)主体功能区划分的研究——以浙江省玉环县、洞头县为例[J]. 地理科学, 2011, 31(7):810-816. |
| ZHANG Y G, ZHANG Y, LIU H. Division of island (county) major function oriented zoning: A case study of Yuhuan and Dongtou, Zhejiang Province, China[J]. Scientia Geographica Sinica, 2011, 31(7): 810-816. | |
| [23] | 阳文锐. 北京城市景观格局时空变化及驱动力[J]. 生态学报, 2015, 35(13):4357-4366. |
| YANG W R. Spatiotemporal change and driving forces of urban landscape pattern in Beijing[J]. Acta Ecologica Sinica, 2015, 35(13): 4357-4366. | |
| [24] | 李秀珍, 布仁仓, 常禹, 等. 景观格局指标对不同景观格局的反应[J]. 生态学报, 2004, 24(1):123-134. |
| LI X Z, BU R C, CHANG Y, et al. The response of landscape metrics against pattern scenarios[J]. Acta Eco-logica Sinica, 2004, 24(1): 123-134. | |
| [25] | 陈文波, 肖笃宁, 李秀珍. 景观指数分类、应用及构建研究[J]. 应用生态学报, 2002, 13(1):121-125. |
| CHEN W B, XIAO D N, LI X Z. Classification, applica-tion, and creation of landscape indices[J]. Chinese Journal of Applied Ecology, 2002, 13(1): 121-125. | |
| [26] | 邬建国. 景观生态学——格局、过程、尺度与等级[M]. 北京: 高等教育出版社, 2000. |
| WU J G. Landscape ecology—Patterns, processes, scales and hierarchies[M]. Beijing: Higher Education Press, 2000. |
| Viewed | ||||||
|
Full text |
|
|||||
|
Abstract |
|
|||||