海洋学研究 ›› 2025, Vol. 43 ›› Issue (1): 1-13.DOI: 10.3969/j.issn.1001-909X.2025.01.001
• 研究论文 • 下一篇
全球内波混合的时空分布特征
黄淑旖1,2( ), 谢晓辉1,2,3,*(), 李少峰1,2
- 1.自然资源部第二海洋研究所,浙江 杭州 310012
2.卫星海洋环境监测预警全国重点实验室,浙江 杭州 310012
3.上海交通大学 海洋学院, 上海 200240
-
收稿日期:2024-02-28修回日期:2024-05-16出版日期:2025-03-15发布日期:2025-05-30 -
通讯作者:*谢晓辉(1982—),男,研究员,主要从事海洋动力过程研究, E-mail: xxie@sio.org.cn。 -
作者简介:黄淑旖(1998—),女,浙江省嘉兴市人,主要从事海洋内部混合过程研究,E-mail: syhuang@sio.org.cn。 -
基金资助:国家重点研发计划(2022YFF0801403);国家自然科学基金(42227901);南方海洋科学与工程广东实验室(珠海)项目(SML2021SP207)
Spatial and temporal characteristic of global internal wave-induced mixing
HUANG Shuyi1,2(), XIE Xiaohui1,2,3,*(), LI Shaofeng1,2
- 1. Second Institute of Oceanography, MNR, Hangzhou 310012, China
2. State Key Laboratory of Satellite Ocean Environment Dynamics, Hangzhou 310012, China
3. School of Oceanography, Shanghai Jiao Tong University, Shanghai 200240, China
-
Received:2024-02-28Revised:2024-05-16Online:2025-03-15Published:2025-05-30
摘要:
为了揭示全球海域内波混合的时空分布规律并探究其影响因素,本文采用内波细尺度参数化方法统计分析了2006—2021年全球250~500 m深度段的Argo温、盐数据,得到内波混合的时空分布特征以及全球海域在不同季节下风生近惯性能通量对内波混合的影响规律。在空间上,北大西洋和南大洋全年都存在较大的风生近惯性能通量,从而产生较强的内波混合;在西太平洋和40°N以北的北太平洋,内波混合与风生近惯性能通量的空间分布不一致,与涡动能的空间分布一致,说明内波混合不仅会受到风生近惯性能通量的影响,可能还会受到涡旋的调控。在时间上,12—2月全球内波混合最强,其次是9—11月和3—5月,6—8月最弱,这与全球风生近惯性能通量的季节变化相一致。在北半球,冬季的风生近惯性能通量和内波混合最大,而夏季风生近惯性能通量和内波混合最小。在南半球,风生近惯性能通量和内波混合四个季节的变化不一致。南、北半球内波混合和风生近惯性能通量的季节循环大致吻合,尤其在北大西洋,风生近惯性能通量和内波混合吻合较好。
中图分类号:
引用本文
黄淑旖, 谢晓辉, 李少峰. 全球内波混合的时空分布特征[J]. 海洋学研究, 2025, 43(1): 1-13.
HUANG Shuyi, XIE Xiaohui, LI Shaofeng. Spatial and temporal characteristic of global internal wave-induced mixing[J]. Journal of Marine Sciences, 2025, 43(1): 1-13.
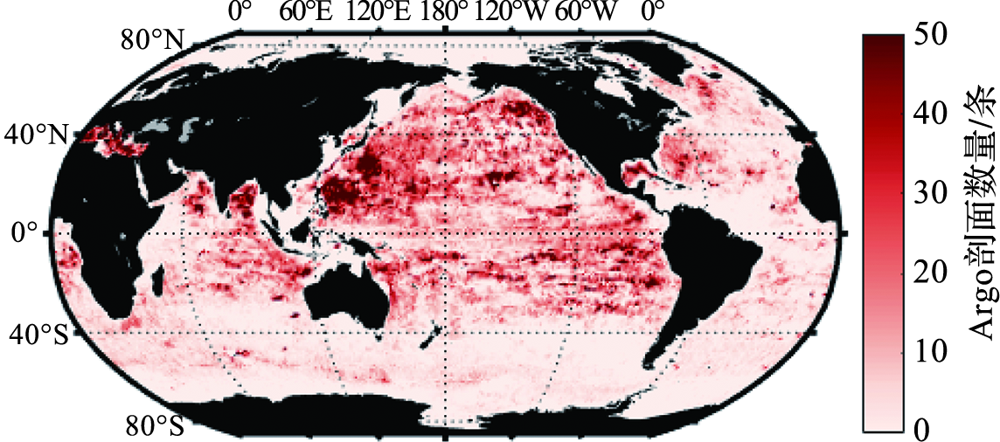
图1 2006—2021年全球Argo剖面数量分布图
Fig.1 The distribution of global Argo profile quantity during 2006-2021
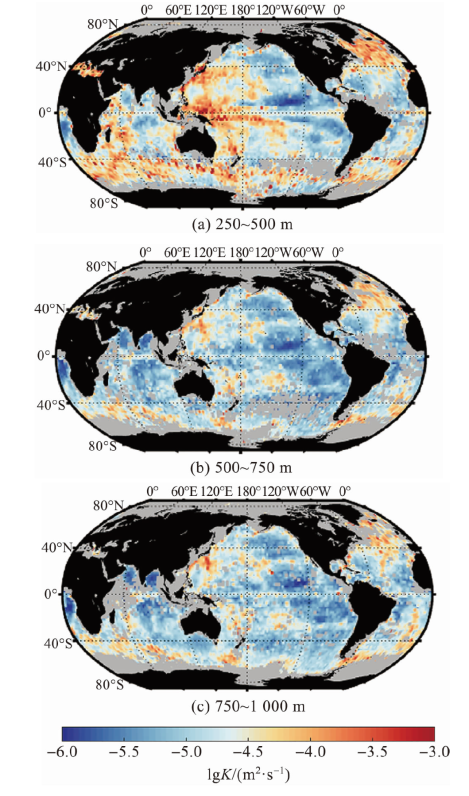
图2 全球不同深度的平均内波混合扩散率 (计算结果的空间分辨率为1°×1°。图中灰色区域代表没有数据的海域。)
Fig.2 The global averaged internal wave-induced mixing diffusivity at different depths (Spatial resolution of the calculation results is 1°×1°. The gray areas in the figure represent seas for which there is no data.)
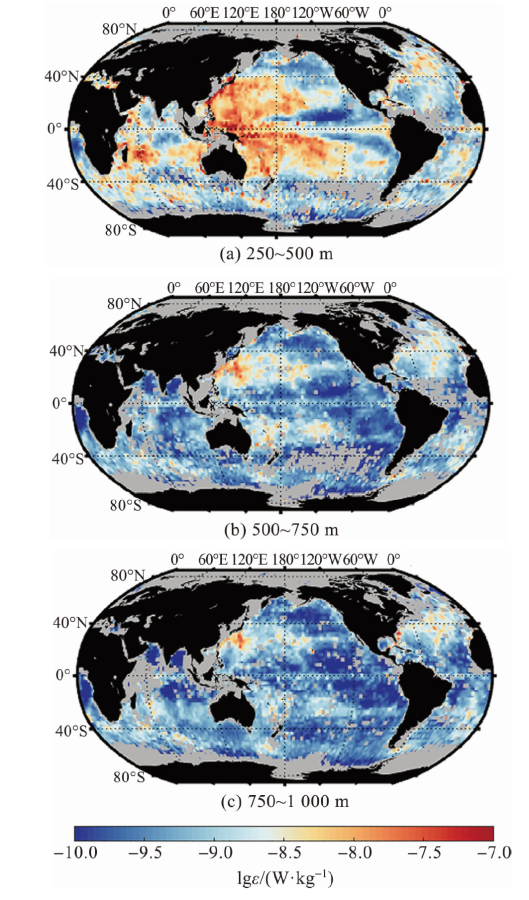
图3 全球不同深度的平均内波混合耗散率 (计算结果的空间分辨率为1°×1°。图中灰色区域代表没有数据的海域。)
Fig.3 The global averaged internal wave-induced mixing dissipation rate at different depths (Spatial resolution of the calculation results is 1°×1°. The gray areas in the figure represent seas for which there is no data.)
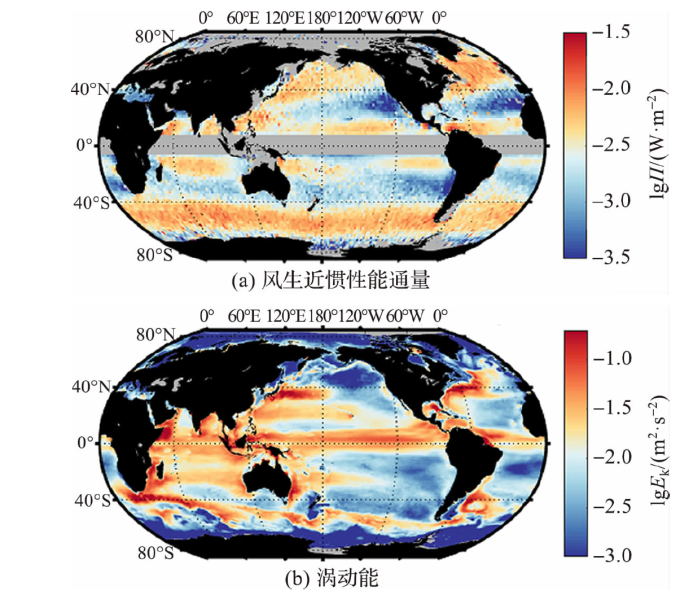
图4 全球表层风生近惯性能通量(a)和涡动能(b)的空间分布
Fig.4 Global spatial pattern of wind-induced near-inertial energy flux (a) and eddy kinetic energy (b) at surface
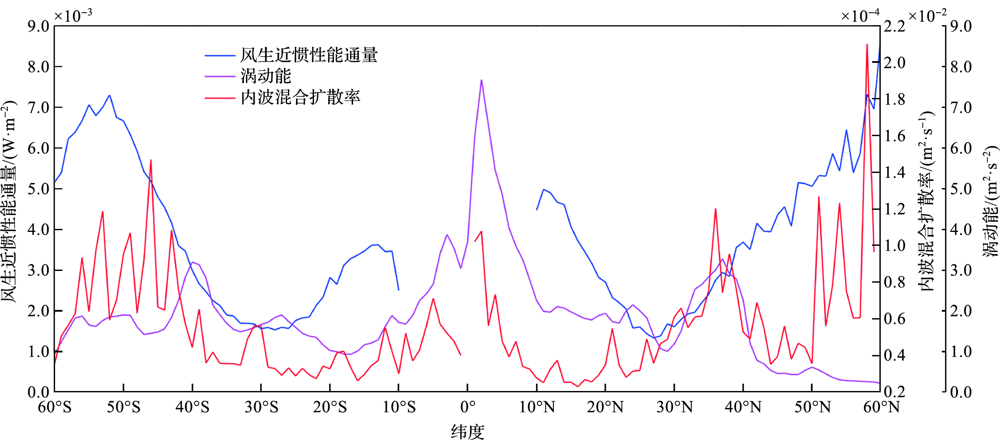
图5 250~500 m层平均内波混合扩散率、表层风生近惯性能通量和涡动能随纬度的变化
Fig.5 Latitude variation of average internal wave-induced mixing diffusivity at 250-500 m, wind-induced near-inertial energy flux and eddy kinetic energy at surface

图6 全球250~500 m层平均内波混合扩散率的季节变化
Fig.6 Seasonal variation of global average internal wave-induced mixing diffusivity at 250-500 m
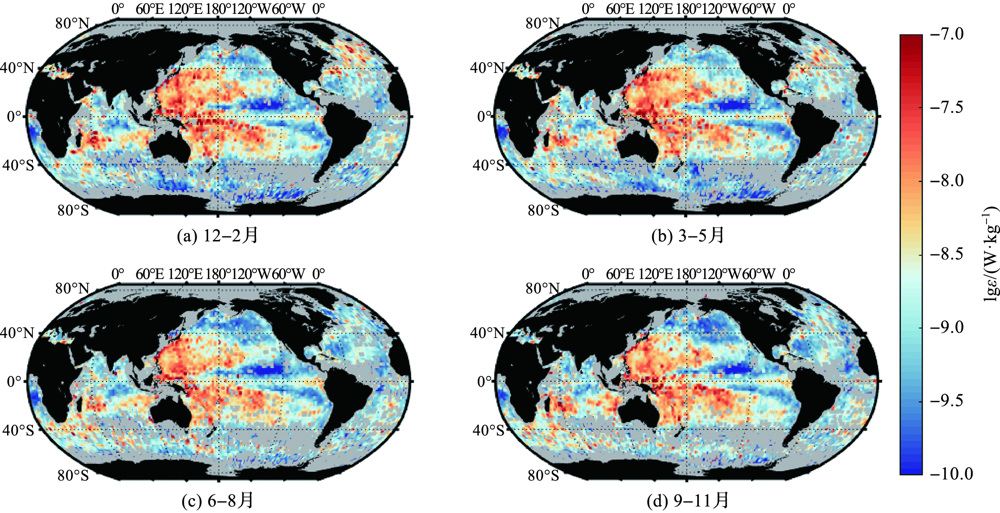
图7 全球250~500 m层平均内波混合耗散率的季节变化
Fig.7 Seasonal variation of global average internal wave-induced mixing dissipation rate at 250-500 m
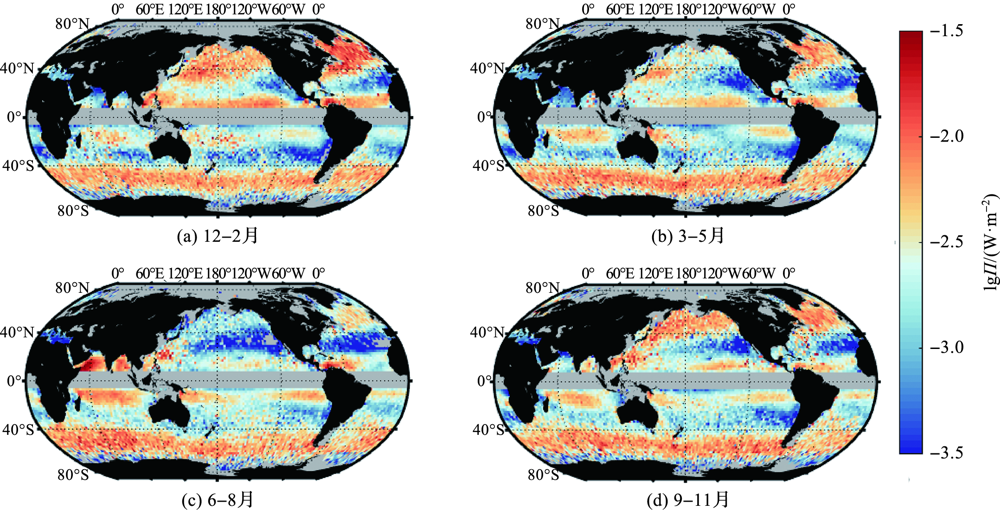
图8 全球表层风生近惯性能通量的季节变化
Fig.8 Season variation of global wind-induced near-inertial energy flux at surface
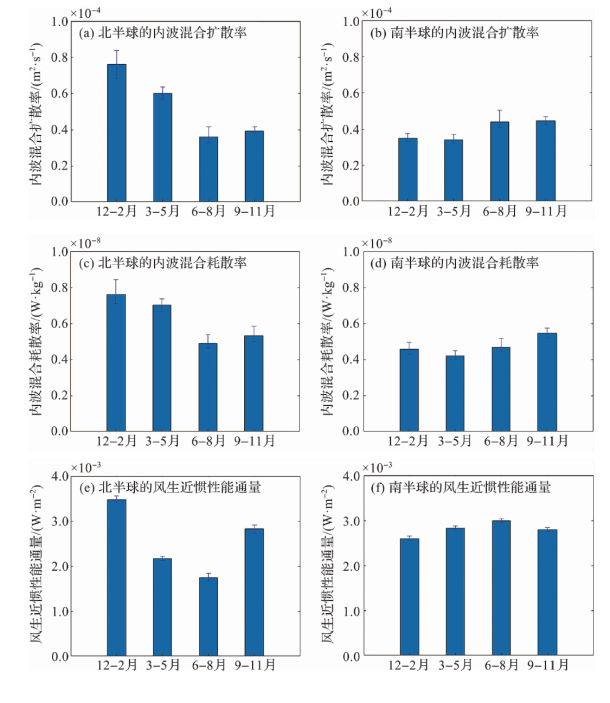
图9 南、北半球250~500 m层平均内波混合扩散率、耗散率以及表层风生近惯性能通量的季节变化 (图中细线表示95%的置信区间。)
Fig.9 Seasonal variation of average internal wave-induced mixing diffusivity, dissipation rate at 250-500 m, and wind-induced near-inertial energy flux at surface in the northern hemisphere and southern hemisphere (The thin line is a 95%confidence interval.)
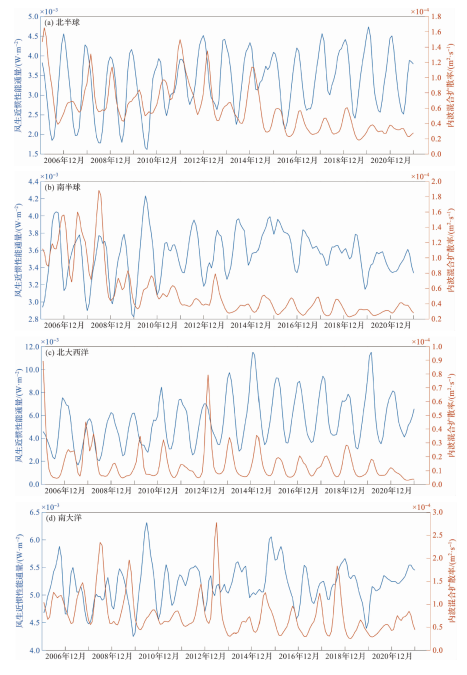
图10 250~500 m层平均内波混合扩散率的月平均时间序列和表层风生近惯性能通量的月平均时间序列
Fig.10 Monthly average time series of average internal wave-induced mixing diffusivity at 250-500 m and wind-induced near-inertial energy flux at surface
| [1] | ZHANG S W, XIE L L, HOU Y J, et al. Tropical storm-induced turbulent mixing and chlorophyll-a enhancement in the continental shelf southeast of Hainan Island[J]. Journal of Marine Systems, 2014, 129: 405-414. |
| [2] | DU C J, LIU Z Y, KAO S J, et al. Diapycnal fluxes of nutrients in an oligotrophic oceanic regime: The South China Sea[J]. Geophysical Research Letters, 2017, 44(22): 11510-11518. |
| [3] | WUNSCH C, FERRARI R. Vertical mixing, energy, and the general circulation of the oceans[J]. Annual Review of Fluid Mechanics, 2004, 36(1): 281-314. |
| [4] | EGBERT G D, RAY R D. Significant dissipation of tidal energy in the deep ocean inferred from satellite altimeter data[J]. Nature, 2000, 405(6788): 775-778. |
| [5] | D’ASARO E A. The energy flux from the wind to near-inertial motions in the surface mixed layer[J]. Journal of Physical Oceanography, 1985, 15(8): 1043-1059. |
| [6] |
ALFORD M H, MACKINNON J A, SIMMONS H L, et al. Near-inertial internal gravity waves in the ocean[J]. Annual Review of Marine Science, 2016, 8: 95-123.
DOI PMID |
| [7] | WHALEN C B, TALLEY L D, MACKINNON J A. Spatial and temporal variability of global ocean mixing inferred from Argo profiles[J]. Geophysical Research Letters, 2012, 39(18): L18612. |
| [8] | MUNK W H. Abyssal recipes[J]. Deep Sea Research and Oceanographic Abstracts, 1966, 13(4): 707-730. |
| [9] | WU L X, JING Z, RISER S, et al. Seasonal and spatial variations of Southern Ocean diapycnal mixing from Argo profiling floats[J]. Nature Geoscience, 2011, 4: 363-366. |
| [10] | JING Z, WU L X. Seasonal variation of turbulent diapycnal mixing in the northwestern Pacific stirred by wind stress[J]. Geophysical Research Letters, 2010, 37(23): L23604. |
| [11] | WHALEN C B, MACKINNON J A, TALLEY L D. Large-scale impacts of the mesoscale environment on mixing from wind-driven internal waves[J]. Nature Geoscience, 2018, 11: 842-847. |
| [12] |
NAVEIRA G A C, POLZIN K L, KING B A, et al. Widespread intense turbulent mixing in the Southern Ocean[J]. Science, 2004, 303(5655): 210-213.
PMID |
| [13] | LI Y, XU Y S. Penetration depth of diapycnal mixing generated by wind stress and flow over topography in the northwestern Pacific[J]. Journal of Geophysical Research: Oceans, 2014, 119(8): 5501-5514. |
| [14] | LI Q, CHEN Z H, GUAN S D, et al. Enhanced near-inertial waves and turbulent diapycnal mixing observed in a cold- and warm-core eddy in the Kuroshio extension region[J]. Journal of Physical Oceanography, 2022, 52(8): 1849-1866. |
| [15] | WATERHOUSE A F, MACKINNON J A, NASH J D, et al. Global patterns of diapycnal mixing from measurements of the turbulent dissipation rate[J]. Journal of Physical Oceanography, 2014, 44(7): 1854-1872. |
| [16] | 刘增宏, 李兆钦, 卢少磊, 等. 全球海洋Argo温盐度剖面散点数据集[J]. 全球变化数据学报, 2021, 5(3):312-321,451-460. |
| LIU Z H, LI Z Q, LU S L, et al. Scattered dataset of global ocean temperature and salinity profiles from the international Argo program[J]. Journal of Global Change Data & Discovery, 2021, 5(3): 312-321, 451-460. | |
| [17] | 黄挺, 周锋, 田娣, 等. 孟加拉湾及其毗邻海域中尺度涡旋活动的冬、夏季差异[J]. 海洋学研究, 2020, 38(3):21-30. |
|
HUANG T, ZHOU F, TIAN D, et al. Seasonal variations of mesoscale eddy in the Bay of Bengal and its adjacent regions[J]. Journal of Marine Sciences, 2020, 38(3): 21-30.
DOI |
|
| [18] | GREGG M C. Scaling turbulent dissipation in the thermocline[J]. Journal of Geophysical Research: Oceans, 1989, 94(C7): 9686-9698. |
| [19] | KUNZE E, FIRING E, HUMMON J M, et al. Global abyssal mixing inferred from lowered ADCP shear and CTD strain profiles[J]. Journal of Physical Oceanography, 2006, 36(8): 1553-1576. |
| [20] | 乔梦甜, 陈娟, 曹安州, 等. 吕宋海峡及周边海域湍流混合的时空分布特征研究[J]. 海洋与湖沼, 2021, 52(5):1115-1124. |
| QIAO M T, CHEN J, CAO A Z, et al. Spatial and temporal distribution of turbulent mixing in the Luzon strait and nearby sea[J]. Oceanologia et Limnologia Sinica, 2021, 52(5): 1115-1124. | |
| [21] | 荆钊. 中尺度涡和风应力影响下的跨等密度面湍流混合低频变异[D]. 青岛: 中国海洋大学, 2012. |
| JING Z. Low-frequency variation of turbulent mixing across equal density surface under the influence of mesoscale vortex and wind stress[D]. Qingdao: Ocean University of China, 2012. | |
| [22] | OSBORN T R. Estimates of the local rate of vertical diffusion from dissipation measurements[J]. Journal of Physical Oceanography, 1980, 10(1): 83-89. |
| [23] | ALFORD M H. Internal swell generation: The spatial distribution of energy flux from the wind to mixed layer near-inertial motions[J]. Journal of Physical Oceanography, 2001, 31(8): 2359-2368. |
| [24] | HUANG P Q, LU Y Z, ZHOU S Q. An objective method for determining ocean mixed layer depth with applications to WOCE data[J]. Journal of Atmospheric and Oceanic Technology, 2018, 35(3): 441-458. |
| [25] | 陈娟, 乔梦甜, 曹安州, 等. 风生近惯性能通量和地形粗糙度对海洋内部混合的影响[J]. 海洋与湖沼, 2021, 52(4):874-885. |
| CHEN J, QIAO M T, CAO A Z, et al. Influence of wind-induced near-inertial energy flux and topographic roughness on ocean internal mixing[J]. Oceanologia et Limnologia Sinica, 2021, 52(4): 874-885. | |
| [26] | 杨兵, 侯一筠. 基于高分辨率风场的海洋近惯性能通量计算:时空特征及其影响因素[J]. 海洋与湖沼, 2020, 51(5):978-990. |
| YANG B, HOU Y J. Wind-generated near-inertial energy flux to the oceans: The spatial-temporal variations and impact factors[J]. Oceanologia et Limnologia Sinica, 2020, 51(5): 978-990. | |
| [27] | RIMAC A, VON STORCH J S, EDEN C, et al. The influence of high-resolution wind stress field on the power input to near-inertial motions in the ocean[J]. Geophysical Research Letters, 2013, 40(18): 4882-4886. |
| [28] | WHALEN C B, MACKINNON J A, TALLEY L D, et al. Estimating the mean diapycnal mixing using a finescale strain parameterization[J]. Journal of Physical Oceanography, 2015, 45(4): 1174-1188. |
| [1] | 张璇, 刘增宏, 陈朝晖, 任翀, 熊海霞, 高志远, 严啸峦, 张林林. 国产深海HM4000型剖面浮标盐度数据校正[J]. 海洋学研究, 2025, 43(1): 14-21. |
| [2] | 郑梦轲, 方巍, 张霄智. 深度学习在印度洋偶极子预测中的应用研究综述[J]. 海洋学研究, 2024, 42(3): 51-63. |
| [3] | 苏涵, 闯子维, 张春玲. GDCSM-Argo数据在全球海洋热含量评估中的应用分析[J]. 海洋学研究, 2024, 42(2): 40-54. |
| [4] | 张旭东, 丘仲锋, 毛科峰, 王鹏皓. 西北太平洋中尺度涡合成结构及其对声传播的影响[J]. 海洋学研究, 2024, 42(1): 58-68. |
| [5] | 赵跃然, 范高晶, 吴嘉琪, 孙维萍, 潘建明, 韩正兵. 南乔治亚岛海域浮游植物季节性旺发特征与POC输出通量:基于BGC-Argo和卫星遥感观测[J]. 海洋学研究, 2023, 41(4): 1-11. |
| [6] | 孟宇, 陈双玲. 海水硝酸盐跃层深度计算方法研究[J]. 海洋学研究, 2023, 41(3): 1-13. |
| [7] | 刘佳, 郑少军, 严厉, 陈航彪, 刘婷甄. 南澳大利亚海盆表层涡动能的时空特征研究[J]. 海洋学研究, 2023, 41(3): 22-33. |
| [8] | 俞杰, 张翰, 陈大可. 基于Argo数据研究南海上层海洋对超强台风“威马逊”(2014)的温盐响应[J]. 海洋学研究, 2023, 41(2): 14-27. |
| [9] | 游高冲, 郭杭, 罗孝文, 等. 基于LS-SVM的多系统融合GNSS-MR潮位反演[J]. 海洋学研究, 2022, 40(1): 72-. |
| [10] | 周永远, 闫运伟, 邢小罡, 柴扉. 基于Argo实测流场数据对5套海洋模式产品中赤道太平洋中层流的评估[J]. 海洋学研究, 2020, 38(3): 1-9. |
| [11] | 谢春虎, 徐苗苗, 曹莎莎, 张勇, 张春玲. 基于梯度依赖客观分析技术的全球Argo网格化数据集:构建及初步应用[J]. 海洋学研究, 2019, 37(4): 24-35. |
| [12] | 董贵莹, 曹敏杰, 张丰, 杜震洪, 刘仁义, 吴森森. Argo资料协同管理方法研究[J]. 海洋学研究, 2017, 35(3): 1-8. |
| [13] | 丁文祥, 梁楚进, 廖光洪, 高立宝. 南极普里兹湾海域湍流扩散系数估计[J]. 海洋学研究, 2017, 35(1): 14-24. |
| [14] | 吴铃蔚, 凌征. 基于Argo资料的西北太平洋海表面盐度对台风的响应特征分析[J]. 海洋学研究, 2015, 33(3): 1-6. |
| [15] | 席婧嫄, 周磊, 姜良红. 全球大洋季节内尺度上海-气相互作用特征分析[J]. 海洋学研究, 2014, 32(3): 1-8. |
| 阅读次数 | ||||||
|
全文 |
|
|||||
|
摘要 |
|
|||||